OPEN-SOURCE SCRIPT
Ripster MTF Clouds
Description:
MTF EMA Cloud By Ripster
EMA Cloud System is a Trading System Invented by Ripster where areas are shaded between two desired EMAs. The concept implies the EMA cloud area serves as support or resistance for Intraday & Swing Trading. This can be utilized effectively on 10 Min for day trading and 1Hr/Daily for Swings. Ripster himself utilizes various combinations of the 5-12, 34-50, 8-9, 20-21 EMA clouds but the possibilities are endless to find what works best for you.
“Ideally, 5-12 or 5-13 EMA cloud acts as a fluid trendline for day trades. 8-9 EMA Clouds can be used as pullback Levels –(optional). Additionally, a high level price over or under 34-50 EMA clouds confirms either bullish or bearish bias on the price action for any timeframe” – Ripster
This indicator is an extension of the Ripster EMA Clouds. It allows you to visualize Exponential Moving Average (EMA) clouds from any time frame on your current chart, regardless of the chart's own time frame. This functionality is especially useful for traders who want to monitor higher time frame trends and support/resistance levels while trading on lower time frames.
What does this code do?
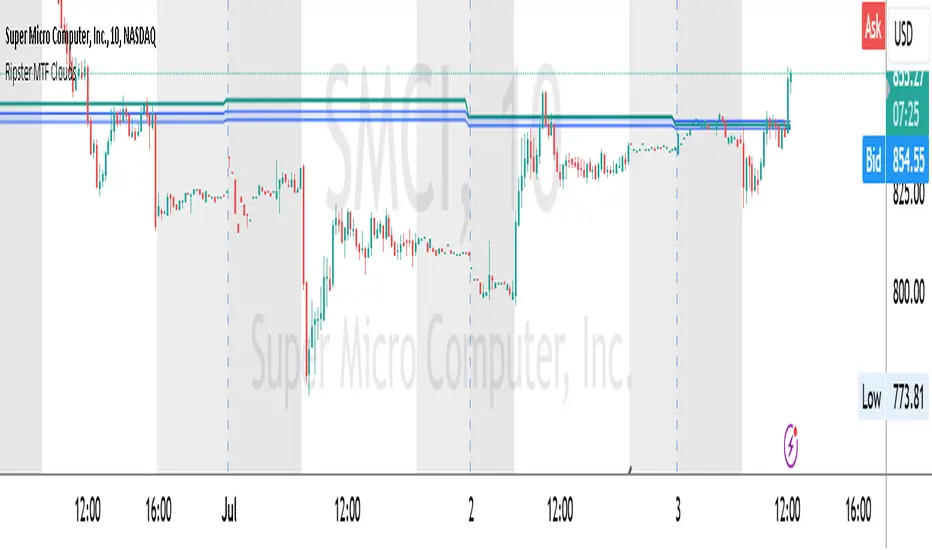
The Ripster MTF Clouds indicator displays two sets of EMA clouds. Each set consists of a short EMA and a long EMA. By default, the indicator uses Daily 20/21 and 50/55 EMAs, but you can customize these settings to fit your trading strategy. The EMAs are plotted on your chart along with their corresponding clouds, colored for easy differentiation:
EMA 1 (default 50/55): Plotted in blue.
EMA 2 (default 20/21): Plotted in teal.
The indicator uses the security function to fetch EMA values from higher time frames and plots them on your current chart, allowing you to see how these higher time frame EMAs interact with your current time frame's price action.
How to use this indicator:
Adjust Resolution:
Set the "Resolution" input to the time frame from which you want to fetch EMA values. For example, set it to "1H" if you want to see 1-hour EMAs on your current chart.
Customize EMAs:
Modify the "EMA 1 Short Length" and "EMA 1 Long Length" inputs to change the default 50/55 EMAs.
Adjust the "EMA 2 Short Length" and "EMA 2 Long Length" inputs to change the default 20/21 EMAs.
Monitor Clouds:
The indicator fills the area between the short and long EMAs, creating a cloud that helps visualize the trend. A blue cloud indicates the area between the EMA 1 pair, while a teal cloud indicates the area between the EMA 2 pair.
Use Multiple Instances:
You can add multiple instances of this indicator to your chart to monitor multiple higher time frames simultaneously. For instance, one instance can show daily clouds while another shows hourly clouds.
Integration with Trading Strategy:
Use this indicator to identify higher time frame trends and support/resistance levels, which can help improve your trading decisions on lower time frames.
For example, you can go long when the stock is above the 50-55 EMA clouds and 20-21 EMA clouds with daily resolution on a 10-minute chart and short when it is below it.
Similarly, you can short a stock under the 1-hour 34/50 EMA clouds while still trading on a 10-minute chart.
MTF EMA Cloud By Ripster
EMA Cloud System is a Trading System Invented by Ripster where areas are shaded between two desired EMAs. The concept implies the EMA cloud area serves as support or resistance for Intraday & Swing Trading. This can be utilized effectively on 10 Min for day trading and 1Hr/Daily for Swings. Ripster himself utilizes various combinations of the 5-12, 34-50, 8-9, 20-21 EMA clouds but the possibilities are endless to find what works best for you.
“Ideally, 5-12 or 5-13 EMA cloud acts as a fluid trendline for day trades. 8-9 EMA Clouds can be used as pullback Levels –(optional). Additionally, a high level price over or under 34-50 EMA clouds confirms either bullish or bearish bias on the price action for any timeframe” – Ripster
This indicator is an extension of the Ripster EMA Clouds. It allows you to visualize Exponential Moving Average (EMA) clouds from any time frame on your current chart, regardless of the chart's own time frame. This functionality is especially useful for traders who want to monitor higher time frame trends and support/resistance levels while trading on lower time frames.
What does this code do?
The Ripster MTF Clouds indicator displays two sets of EMA clouds. Each set consists of a short EMA and a long EMA. By default, the indicator uses Daily 20/21 and 50/55 EMAs, but you can customize these settings to fit your trading strategy. The EMAs are plotted on your chart along with their corresponding clouds, colored for easy differentiation:
EMA 1 (default 50/55): Plotted in blue.
EMA 2 (default 20/21): Plotted in teal.
The indicator uses the security function to fetch EMA values from higher time frames and plots them on your current chart, allowing you to see how these higher time frame EMAs interact with your current time frame's price action.
How to use this indicator:
Adjust Resolution:
Set the "Resolution" input to the time frame from which you want to fetch EMA values. For example, set it to "1H" if you want to see 1-hour EMAs on your current chart.
Customize EMAs:
Modify the "EMA 1 Short Length" and "EMA 1 Long Length" inputs to change the default 50/55 EMAs.
Adjust the "EMA 2 Short Length" and "EMA 2 Long Length" inputs to change the default 20/21 EMAs.
Monitor Clouds:
The indicator fills the area between the short and long EMAs, creating a cloud that helps visualize the trend. A blue cloud indicates the area between the EMA 1 pair, while a teal cloud indicates the area between the EMA 2 pair.
Use Multiple Instances:
You can add multiple instances of this indicator to your chart to monitor multiple higher time frames simultaneously. For instance, one instance can show daily clouds while another shows hourly clouds.
Integration with Trading Strategy:
Use this indicator to identify higher time frame trends and support/resistance levels, which can help improve your trading decisions on lower time frames.
For example, you can go long when the stock is above the 50-55 EMA clouds and 20-21 EMA clouds with daily resolution on a 10-minute chart and short when it is below it.
Similarly, you can short a stock under the 1-hour 34/50 EMA clouds while still trading on a 10-minute chart.
开源脚本
秉承TradingView的精神,该脚本的作者将其开源,以便交易者可以查看和验证其功能。向作者致敬!您可以免费使用该脚本,但请记住,重新发布代码须遵守我们的网站规则。
免责声明
这些信息和出版物并非旨在提供,也不构成TradingView提供或认可的任何形式的财务、投资、交易或其他类型的建议或推荐。请阅读使用条款了解更多信息。
免责声明
这些信息和出版物并非旨在提供,也不构成TradingView提供或认可的任何形式的财务、投资、交易或其他类型的建议或推荐。请阅读使用条款了解更多信息。