OPEN-SOURCE SCRIPT
已更新 GT-Fib
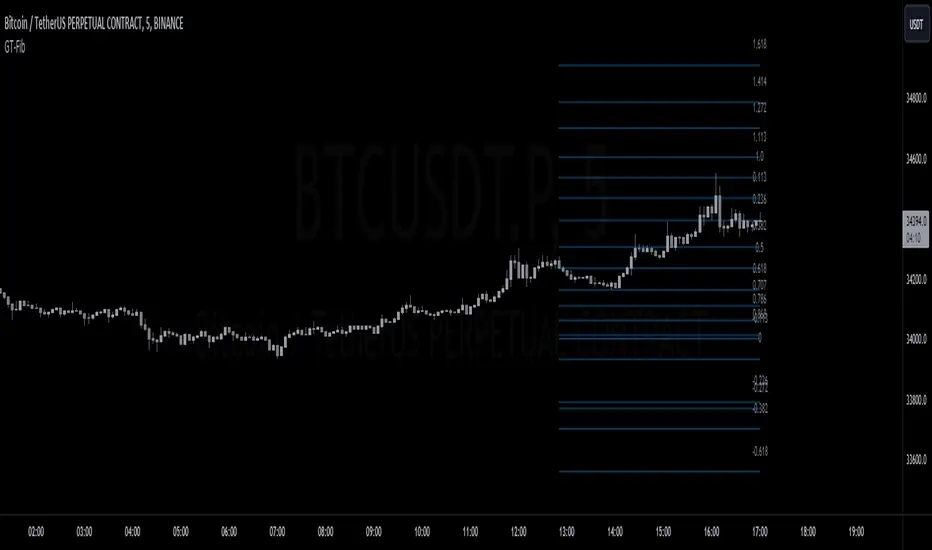
This code is declaring the script as an indicator named "GT-Fib" to be plotted on the main chart. The maximum number of lines it can create is limited to 500.
The indicator calculates Fibo using trend breaks. If the trend is not broken and the old trend continues, Fibo continues. However, sometimes you will witness that it does not draw Fibo. Indicates that there is no trend break yet. If current Fibo levels are behind us, it may be wise to wait for a trend change. For trend breaks, I partially benefited from the Lux team's trend lines with break indicator. For your information...

Settings:
A set of user inputs is defined to allow customization. These include lookback period, coefficient, calculation method, and an option to enable/disable backpainting. These inputs help the trader to adapt the script to different market conditions or trading strategies.
Style:
Colors and visual styles for the indicator are defined here, such as the colors for uptrends and downtrends.
Variables Initialization:
Various variables are initialized here. This section prepares the script for further calculations. Key concepts include the initialization of upper and lower boundaries, pivot highs (ph), pivot lows (pl), and a few other variables to track peaks and troughs for trendlines.
Trendline Peaks and Troughs:
The script identifies pivot highs and lows. Whenever a pivot high/low is found, it updates the trendline_top and trendline_bottom respectively.
Calculation Method:
Based on the user's choice, the script calculates a "cycle" value using one of three methods: ATR, Stdev, or Linreg.
Extended Lines:
These are dashed lines that get drawn when a pivot high or pivot low is identified. These lines can be used to visualize potential support or resistance areas.
plotFibRetracement Function:
This function is designed to draw Fibonacci retracement levels between the identified trendline top and bottom. The Fibonacci levels provide potential support and resistance levels that traders often use to make trading decisions.
Plotting Fibonacci using Trendline Peaks and Troughs:
If both trendline_top and trendline_bottom are not 'na' (not available), the script will draw the Fibonacci retracement using the defined function.
How to Use:
The script identifies and displays potential support and resistance zones using Fibonacci retracement levels based on the trendline peaks and troughs. Here's a suggested way to use it:
Adjust Settings: Depending on the instrument you're trading and the timeframe, you might want to adjust the lookback period, coefficient, and calculation method to fine-tune the script to your needs.
Identify Trends: Observe where the pivot highs and lows are formed. The presence of consecutive pivot highs or pivot lows can indicate a prevailing trend.
Use Fibonacci Levels: The Fibonacci retracement levels can act as potential support and resistance. For instance:
During an uptrend, if prices retract and approach a Fibonacci level, it might act as a support level where price could bounce back.
During a downtrend, Fibonacci levels might act as resistance where price could reverse downwards.
Combine with Other Indicators: For a more comprehensive analysis and to increase the reliability of trading signals, you can use this script in conjunction with other technical indicators.
Remember, like all trading tools and techniques, this script should be used in conjunction with proper risk management. It's also a good idea to test any strategy or tool in a demo environment before applying it to a live account.
The indicator calculates Fibo using trend breaks. If the trend is not broken and the old trend continues, Fibo continues. However, sometimes you will witness that it does not draw Fibo. Indicates that there is no trend break yet. If current Fibo levels are behind us, it may be wise to wait for a trend change. For trend breaks, I partially benefited from the Lux team's trend lines with break indicator. For your information...
Settings:
A set of user inputs is defined to allow customization. These include lookback period, coefficient, calculation method, and an option to enable/disable backpainting. These inputs help the trader to adapt the script to different market conditions or trading strategies.
Style:
Colors and visual styles for the indicator are defined here, such as the colors for uptrends and downtrends.
Variables Initialization:
Various variables are initialized here. This section prepares the script for further calculations. Key concepts include the initialization of upper and lower boundaries, pivot highs (ph), pivot lows (pl), and a few other variables to track peaks and troughs for trendlines.
Trendline Peaks and Troughs:
The script identifies pivot highs and lows. Whenever a pivot high/low is found, it updates the trendline_top and trendline_bottom respectively.
Calculation Method:
Based on the user's choice, the script calculates a "cycle" value using one of three methods: ATR, Stdev, or Linreg.
Extended Lines:
These are dashed lines that get drawn when a pivot high or pivot low is identified. These lines can be used to visualize potential support or resistance areas.
plotFibRetracement Function:
This function is designed to draw Fibonacci retracement levels between the identified trendline top and bottom. The Fibonacci levels provide potential support and resistance levels that traders often use to make trading decisions.
Plotting Fibonacci using Trendline Peaks and Troughs:
If both trendline_top and trendline_bottom are not 'na' (not available), the script will draw the Fibonacci retracement using the defined function.
How to Use:
The script identifies and displays potential support and resistance zones using Fibonacci retracement levels based on the trendline peaks and troughs. Here's a suggested way to use it:
Adjust Settings: Depending on the instrument you're trading and the timeframe, you might want to adjust the lookback period, coefficient, and calculation method to fine-tune the script to your needs.
Identify Trends: Observe where the pivot highs and lows are formed. The presence of consecutive pivot highs or pivot lows can indicate a prevailing trend.
Use Fibonacci Levels: The Fibonacci retracement levels can act as potential support and resistance. For instance:
During an uptrend, if prices retract and approach a Fibonacci level, it might act as a support level where price could bounce back.
During a downtrend, Fibonacci levels might act as resistance where price could reverse downwards.
Combine with Other Indicators: For a more comprehensive analysis and to increase the reliability of trading signals, you can use this script in conjunction with other technical indicators.
Remember, like all trading tools and techniques, this script should be used in conjunction with proper risk management. It's also a good idea to test any strategy or tool in a demo environment before applying it to a live account.
版本注释
*More Fib Levels开源脚本
秉承TradingView的精神,该脚本的作者将其开源,以便交易者可以查看和验证其功能。向作者致敬!您可以免费使用该脚本,但请记住,重新发布代码须遵守我们的网站规则。
免责声明
这些信息和出版物并非旨在提供,也不构成TradingView提供或认可的任何形式的财务、投资、交易或其他类型的建议或推荐。请阅读使用条款了解更多信息。
开源脚本
秉承TradingView的精神,该脚本的作者将其开源,以便交易者可以查看和验证其功能。向作者致敬!您可以免费使用该脚本,但请记住,重新发布代码须遵守我们的网站规则。
免责声明
这些信息和出版物并非旨在提供,也不构成TradingView提供或认可的任何形式的财务、投资、交易或其他类型的建议或推荐。请阅读使用条款了解更多信息。