OPEN-SOURCE SCRIPT
EMA vs TMA Regime Filter
EMA vs TMA Regime Filter
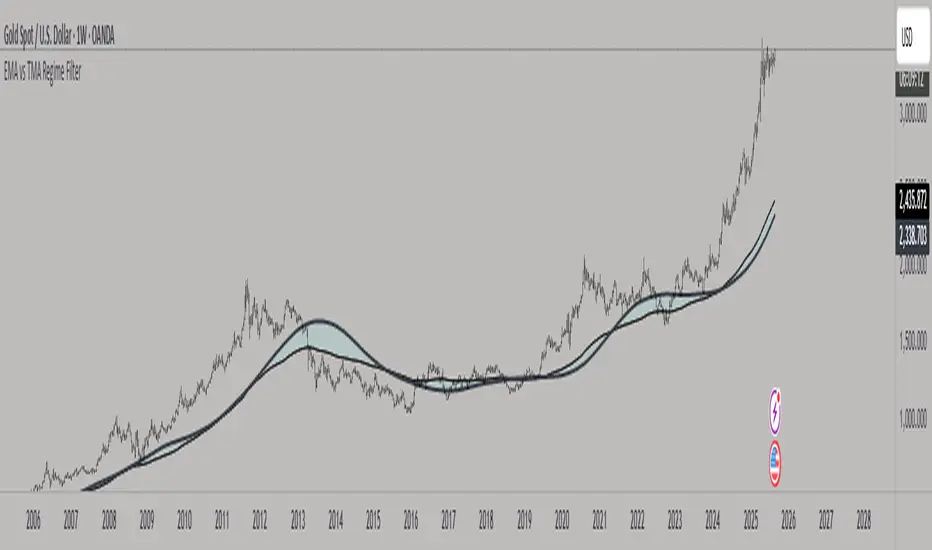
This indicator is built as a visual study tool to compare the behavior of the Exponential Moving Average (EMA) and the Triangular Moving Average (TMA).
The EMA applies an exponential weighting to price data, giving stronger importance to the most recent values. This makes it a faster, more responsive line that reflects short-term momentum. The TMA, by contrast, applies a double-smoothing process (or in the “True TMA” option, a split SMA sequence), which produces a much slower curve. The TMA emphasizes balance over reactivity, often used for filtering noise and observing longer-term structure.
When both are plotted on the same chart, their differences become clear. The shaded region between them highlights times when short-term price dynamics diverge from longer-term smoothing. This is where the idea of “regime” comes in — not as a trading signal, but as a descriptive way of seeing whether market action is currently dominated by speed or by stability.
Users can customize:
The goal is not to create a system, but to help traders experiment, observe, and learn how different smoothing techniques can emphasize different aspects of price. By switching between the legacy and true TMA, or adjusting lengths, users can study how each approach interprets the same data differently.
This indicator is built as a visual study tool to compare the behavior of the Exponential Moving Average (EMA) and the Triangular Moving Average (TMA).
The EMA applies an exponential weighting to price data, giving stronger importance to the most recent values. This makes it a faster, more responsive line that reflects short-term momentum. The TMA, by contrast, applies a double-smoothing process (or in the “True TMA” option, a split SMA sequence), which produces a much slower curve. The TMA emphasizes balance over reactivity, often used for filtering noise and observing longer-term structure.
When both are plotted on the same chart, their differences become clear. The shaded region between them highlights times when short-term price dynamics diverge from longer-term smoothing. This is where the idea of “regime” comes in — not as a trading signal, but as a descriptive way of seeing whether market action is currently dominated by speed or by stability.
Users can customize:
- Line styles, widths, and colors.
- Cloud transparency for visual clarity.
- Whether to color bars based on relative position (optional, purely visual).
The goal is not to create a system, but to help traders experiment, observe, and learn how different smoothing techniques can emphasize different aspects of price. By switching between the legacy and true TMA, or adjusting lengths, users can study how each approach interprets the same data differently.
开源脚本
秉承TradingView的精神,该脚本的作者将其开源,以便交易者可以查看和验证其功能。向作者致敬!您可以免费使用该脚本,但请记住,重新发布代码须遵守我们的网站规则。
免责声明
这些信息和出版物并非旨在提供,也不构成TradingView提供或认可的任何形式的财务、投资、交易或其他类型的建议或推荐。请阅读使用条款了解更多信息。
免责声明
这些信息和出版物并非旨在提供,也不构成TradingView提供或认可的任何形式的财务、投资、交易或其他类型的建议或推荐。请阅读使用条款了解更多信息。