PROTECTED SOURCE SCRIPT
已更新 PXD 1D: Multi-Timeframe Composite Trend
Real-time indication of Combination "Super-Stack State" conditions (indicator signal synergy across multiple pivotal Timeframes).
How do you use it? A Super-Stack State is a powerful signal giving you clear indication of the current sentiment regarding the Symbol being analyzed. Watch the strength increase, visualize how long it has been in this condition and visualize any weakness as it appears in the current trend. Additionally this indicator combines Squeeze Indication (Chapter 11 "Mastering the Trade" by John Carter) allowing assessment of potential Support/ Resistance levels to determine if the Symbol will observe them or not.
My interpretation builds on my Multi-Timeframe Simple Trend indicator and combines it with my custom Squeeze indicator.
Simple Trend State indication is calculated based on the Current Angle of an SMA Length "L". A Simple moving average is used as an Array Function has to be used to calculate the current MA Value for Time Frames < Chart. The output is the current angle of the moving average. +ve indicates Trending Up, -ve indicates Trending Down. The angle is then classified in 1 of 5 states as follows:
Long Trend State = Current Angle > Min Long Angle
Bullish Trend State = Current Angle < Min Long Angle and Current Angle > Max Reversal Angle
Neutral Trend State = Current Angle < Max Reversal Angle and Current Angle > Min Reversal Angle
Bearish Trend State = Current Angle < Min Reversal Angle and Current Angle > Max Short Angle
Short Trend State = Current Angle < Max Short Angle
I use Gann Angle based State Angle definitions in my charts.
Squeeze recap: John Carter's Squeeze System is based on conditions where the Bollinger Band trends inside the Keltner Channel. This indicates a contraction in the volatility of the asset. This contraction can be an indication of EITHER Support or Resistance. By applying a factor to either the Bollinger or Keltner calculation an indication of the strength of the Support/ Resistance can be determined. This is indicated by the following:
State 1: Blank = No Squeeze
State 2: Yellow = Weak Squeeze State
State 3: Orange = Medium Squeeze State
State 4: Red = Strong Squeeze State
In addition to the Squeeze State the Squeeze Momentum is also output. This can be thought of as similar to a classic MACD Histogram (no histogram). The Squeeze Momentum has 4 states as follows:
State 1 = -ve Increasing
State 2 = +ve Increasing
State 3 = +ve Decreasing
State 4 = -ve Decreasing
To create the Composite Indication Signal the above States are scored and then combined. Based on the score the size and direction of the arrow icon are determined. Output is 1 of 4 states as follows:
State 1 = No Signal
State 2 = Weak Signal
State 3 = Medium Signal
State 4 = Strong Signal
Color of the signal is equated to the current SMA color. Output colors of the SMA and Squeeze Momentum States are controlled in the GUI.
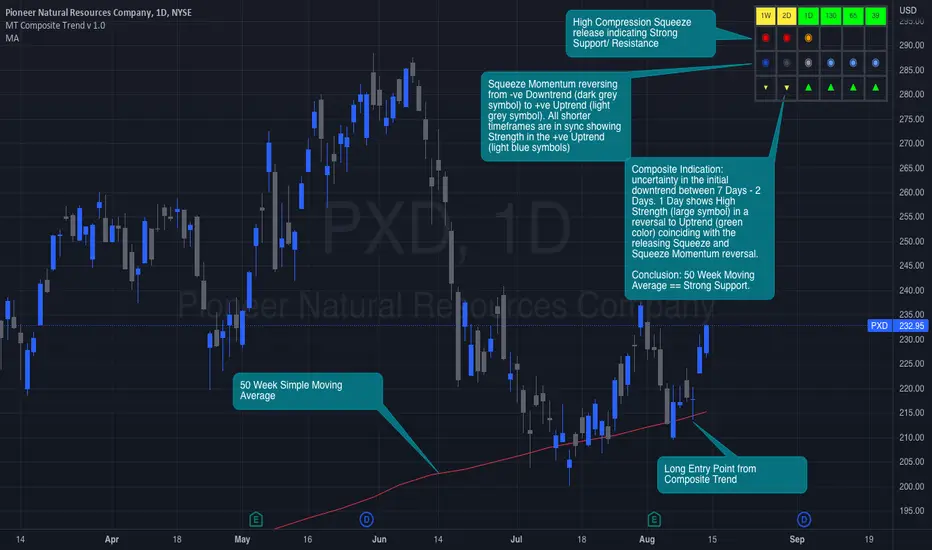
Row 1: your Simple Trend State indication.
Row 2: Custom Squeeze State indication.
Row 3: Custom Squeeze Momentum State indication.
Row 4: Composite State indication. Symbol size and color indication calculated based on a combination of the signals in Row 1-3.
IMPORTANT NOTE: follow Tool Tip guidance when selecting your Pivotal Timeframes. Indicator makes use of the new TradingView Lower Timeframe security request so if you don't follow the directions indicator will return an error.
How do you use it? A Super-Stack State is a powerful signal giving you clear indication of the current sentiment regarding the Symbol being analyzed. Watch the strength increase, visualize how long it has been in this condition and visualize any weakness as it appears in the current trend. Additionally this indicator combines Squeeze Indication (Chapter 11 "Mastering the Trade" by John Carter) allowing assessment of potential Support/ Resistance levels to determine if the Symbol will observe them or not.
My interpretation builds on my Multi-Timeframe Simple Trend indicator and combines it with my custom Squeeze indicator.
Simple Trend State indication is calculated based on the Current Angle of an SMA Length "L". A Simple moving average is used as an Array Function has to be used to calculate the current MA Value for Time Frames < Chart. The output is the current angle of the moving average. +ve indicates Trending Up, -ve indicates Trending Down. The angle is then classified in 1 of 5 states as follows:
Long Trend State = Current Angle > Min Long Angle
Bullish Trend State = Current Angle < Min Long Angle and Current Angle > Max Reversal Angle
Neutral Trend State = Current Angle < Max Reversal Angle and Current Angle > Min Reversal Angle
Bearish Trend State = Current Angle < Min Reversal Angle and Current Angle > Max Short Angle
Short Trend State = Current Angle < Max Short Angle
I use Gann Angle based State Angle definitions in my charts.
Squeeze recap: John Carter's Squeeze System is based on conditions where the Bollinger Band trends inside the Keltner Channel. This indicates a contraction in the volatility of the asset. This contraction can be an indication of EITHER Support or Resistance. By applying a factor to either the Bollinger or Keltner calculation an indication of the strength of the Support/ Resistance can be determined. This is indicated by the following:
State 1: Blank = No Squeeze
State 2: Yellow = Weak Squeeze State
State 3: Orange = Medium Squeeze State
State 4: Red = Strong Squeeze State
In addition to the Squeeze State the Squeeze Momentum is also output. This can be thought of as similar to a classic MACD Histogram (no histogram). The Squeeze Momentum has 4 states as follows:
State 1 = -ve Increasing
State 2 = +ve Increasing
State 3 = +ve Decreasing
State 4 = -ve Decreasing
To create the Composite Indication Signal the above States are scored and then combined. Based on the score the size and direction of the arrow icon are determined. Output is 1 of 4 states as follows:
State 1 = No Signal
State 2 = Weak Signal
State 3 = Medium Signal
State 4 = Strong Signal
Color of the signal is equated to the current SMA color. Output colors of the SMA and Squeeze Momentum States are controlled in the GUI.
Row 1: your Simple Trend State indication.
Row 2: Custom Squeeze State indication.
Row 3: Custom Squeeze Momentum State indication.
Row 4: Composite State indication. Symbol size and color indication calculated based on a combination of the signals in Row 1-3.
IMPORTANT NOTE: follow Tool Tip guidance when selecting your Pivotal Timeframes. Indicator makes use of the new TradingView Lower Timeframe security request so if you don't follow the directions indicator will return an error.
版本注释
v1.1 Update to correct scaling issue when using intraday timeframes受保护脚本
此脚本以闭源形式发布。 但是,您可以自由使用,没有任何限制 — 了解更多信息这里。
免责声明
这些信息和出版物并非旨在提供,也不构成TradingView提供或认可的任何形式的财务、投资、交易或其他类型的建议或推荐。请阅读使用条款了解更多信息。
免责声明
这些信息和出版物并非旨在提供,也不构成TradingView提供或认可的任何形式的财务、投资、交易或其他类型的建议或推荐。请阅读使用条款了解更多信息。