OPEN-SOURCE SCRIPT
Cantom Chart - CL CTG vs BKD
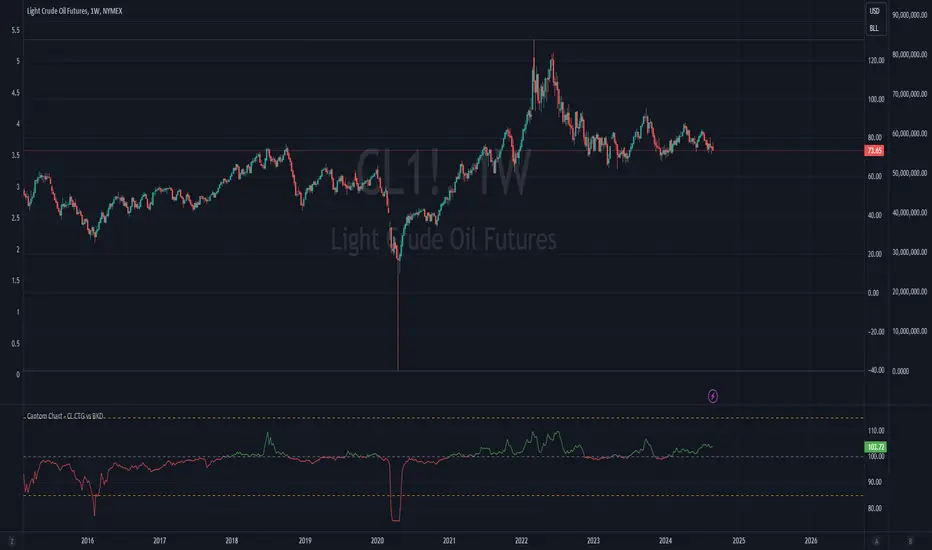
English: This Pine Script indicator, named "Cantom Chart - CL CTG vs BKD," uniquely analyzes the immediate state of oil futures contracts to determine if they are in contango or backwardation. The script uses the price ratio between the nearest (CL1) and the next nearest (CL2) NYMEX crude oil futures contracts. It multiplies this ratio by 100 for clarity and scales fluctuations for enhanced visibility.
Key Features:
Usage: This indicator is especially useful for traders analyzing supply-demand dynamics and inflationary pressures in the oil market. To apply it, simply add the script to your TradingView chart and adjust the 'Lower Threshold' and 'Upper Threshold' lines as needed based on your trading strategy.
-----
日本語: この「Cantom Chart - CL CTG vs BKD」Pine Scriptインジケーターは、直近の原油先物契約がコンタンゴまたはバックワーデーションにあるかを特定するための独自の分析を提供します。最近の(CL1)と次の(CL2)NYMEX原油先物契約間の価格比を使用し、この比率に100を掛けて明確性を高め、変動の視認性を向上させます。
主要機能:
使用方法: このインジケーターは、原油市場における需給ダイナミクスとインフレ圧力を分析するトレーダーにとって特に有用です。使用するには、このスクリプトをTradingViewチャートに追加し、トレーディング戦略に基づいて「Lower Threshold」と「Upper Threshold」のラインを必要に応じて調整します。
Key Features:
- Dynamic Ratio Calculation: Computes the ratio (CL1/CL2 * 100) to determine the immediate market state.
- Market State Interpretation: A ratio above 100 indicates backwardation, suggesting higher demand than supply, while a ratio below 100 indicates contango, suggesting higher supply than demand.
- Volatility Adjustment: Amplifies market state changes by tripling the deviation from the baseline of 100, making it easier to observe subtle shifts.
- Anomaly Detection: Caps the adjusted ratio at 125 for highs and 75 for lows, maintaining these limits until the ratio returns to normal levels.
Usage: This indicator is especially useful for traders analyzing supply-demand dynamics and inflationary pressures in the oil market. To apply it, simply add the script to your TradingView chart and adjust the 'Lower Threshold' and 'Upper Threshold' lines as needed based on your trading strategy.
-----
日本語: この「Cantom Chart - CL CTG vs BKD」Pine Scriptインジケーターは、直近の原油先物契約がコンタンゴまたはバックワーデーションにあるかを特定するための独自の分析を提供します。最近の(CL1)と次の(CL2)NYMEX原油先物契約間の価格比を使用し、この比率に100を掛けて明確性を高め、変動の視認性を向上させます。
主要機能:
- 動的比率計算: 市場の即時状態を判断するために比率(CL1/CL2 * 100)を計算します。
- 市場状態の解釈: 比率が100を超える場合はバックワーデーション(需要が供給を上回る)、100未満の場合はコンタンゴ(供給が需要を上回る)を示します。
- 変動調整: 基準値100からの偏差を3倍にして、微妙な変化を容易に観察できるようにします。
- 異常値検出: 調整された比率を高値で125、低値で75に制限し、通常のレベルに戻るまでこれらの限界を維持します。
使用方法: このインジケーターは、原油市場における需給ダイナミクスとインフレ圧力を分析するトレーダーにとって特に有用です。使用するには、このスクリプトをTradingViewチャートに追加し、トレーディング戦略に基づいて「Lower Threshold」と「Upper Threshold」のラインを必要に応じて調整します。
开源脚本
秉承TradingView的精神,该脚本的作者将其开源,以便交易者可以查看和验证其功能。向作者致敬!您可以免费使用该脚本,但请记住,重新发布代码须遵守我们的网站规则。
免责声明
这些信息和出版物并非旨在提供,也不构成TradingView提供或认可的任何形式的财务、投资、交易或其他类型的建议或推荐。请阅读使用条款了解更多信息。
开源脚本
秉承TradingView的精神,该脚本的作者将其开源,以便交易者可以查看和验证其功能。向作者致敬!您可以免费使用该脚本,但请记住,重新发布代码须遵守我们的网站规则。
免责声明
这些信息和出版物并非旨在提供,也不构成TradingView提供或认可的任何形式的财务、投资、交易或其他类型的建议或推荐。请阅读使用条款了解更多信息。