OPEN-SOURCE SCRIPT
stock-vs-industry using NQUSB benchmark idexes
Original idea from Stock versus Industry by Tr33man.
━━━━━━━━━━━━━━━━━━━━━━━━━━━━━━━━━━━━━━━━
═══ PRIMARY IMPROVEMENT: NQUSB Hierarchical Index Benchmarks ═══
The KEY improvement: Multi-Level Industry Granularity with Drill-Down/Drill-Up Navigation
From: Simple ETF Comparison (1 Level) Stock → Industry ETF (e.g., "SOXX" for all semiconductors)
To: NQUSB Hierarchical Comparison (4 Levels)
Users can now drill up and down the industry hierarchy to see how their stock performs against different levels of industry classification!
━━━━━━━━━━━━━━━━━━━━━━━━━━━━━━━━━━━━━━━━
═══ WHY THIS MATTERS ═══
Original Limitations:
Improved Capabilities:
━━━━━━━━━━━━━━━━━━━━━━━━━━━━━━━━━━━━━━━━
═══ EXAMPLE: ANALYZING NVDA (Semiconductors) ═══
Level 4 - Primary (Most Specific):
NQUSB10102010 - Semiconductors
→ NVDA vs. AMD, AVGO, QCOM, TXN, etc. (direct competitors)
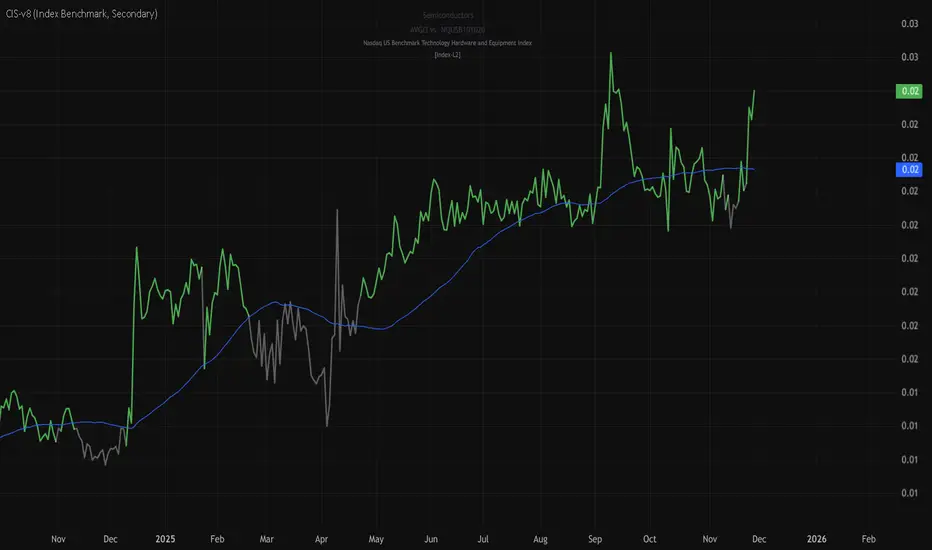
Level 3 - Secondary (Broader):
NQUSB101020 - Tech Hardware & Equipment
→ NVDA vs. AAPL, CSCO + semiconductors
Level 2 - Tertiary (Even Broader):
NQUSB101010 - Software and Computer Services
→ NVDA vs. all tech hardware
Level 1 - Quaternary (Broadest):
NQUSB10 - Technology Sector
→ NVDA vs. entire technology sector
You can now zoom in to see direct competitors or zoom out to understand macro sector trends - all in one indicator!
━━━━━━━━━━━━━━━━━━━━━━━━━━━━━━━━━━━━━━━━
═══ COMPARISON SUMMARY ═══
Original Version:
Improved Version:
━━━━━━━━━━━━━━━━━━━━━━━━━━━━━━━━━━━━━━━━
═══ ADDITIONAL FEATURES ═══
━━━━━━━━━━━━━━━━━━━━━━━━━━━━━━━━━━━━━━━━
For complete documentation, data files, technical details, and the full NQUSB hierarchy structure, visit the GitHub repository.
The result: More accurate, more flexible, and more comprehensive industry strength analysis - enabling traders to understand exactly where their stock's performance comes from by drilling through multiple levels of industry classification.
━━━━━━━━━━━━━━━━━━━━━━━━━━━━━━━━━━━━━━━━
═══ PRIMARY IMPROVEMENT: NQUSB Hierarchical Index Benchmarks ═══
The KEY improvement: Multi-Level Industry Granularity with Drill-Down/Drill-Up Navigation
From: Simple ETF Comparison (1 Level) Stock → Industry ETF (e.g., "SOXX" for all semiconductors)
To: NQUSB Hierarchical Comparison (4 Levels)
- Level 4 (Primary): NQUSB10102010 → Semiconductors (most specific)
- Level 3 (Secondary): NQUSB101020 → Technology Hardware and Equipment
- Level 2 (Tertiary): NQUSB101010 → Software and Computer Services
- Level 1 (Quaternary): NQUSB10 → Technology (broadest sector)
Users can now drill up and down the industry hierarchy to see how their stock performs against different levels of industry classification!
━━━━━━━━━━━━━━━━━━━━━━━━━━━━━━━━━━━━━━━━
═══ WHY THIS MATTERS ═══
Original Limitations:
- Single comparison level - ETF only
- No drill-down capability - Can't zoom in to more specific industries
- No drill-up capability - Can't zoom out to broader sectors
- ETF limitations - Not all industries have dedicated ETFs
- Arbitrary mappings - Manual ETF selection may not represent true industry
Improved Capabilities:
- 4-level hierarchical navigation - Drill-down and drill-up through industry classifications
- 361 NQUSB official indices - NASDAQ US Benchmark Index structure
- Official NASDAQ classification - Industry-standard taxonomy
- Large Mid Cap (LM) option - Focus on larger companies when needed
- Enhanced UI - Clear level indicators and full index descriptions
━━━━━━━━━━━━━━━━━━━━━━━━━━━━━━━━━━━━━━━━
═══ EXAMPLE: ANALYZING NVDA (Semiconductors) ═══
Level 4 - Primary (Most Specific):
NQUSB10102010 - Semiconductors
→ NVDA vs. AMD, AVGO, QCOM, TXN, etc. (direct competitors)
Level 3 - Secondary (Broader):
NQUSB101020 - Tech Hardware & Equipment
→ NVDA vs. AAPL, CSCO + semiconductors
Level 2 - Tertiary (Even Broader):
NQUSB101010 - Software and Computer Services
→ NVDA vs. all tech hardware
Level 1 - Quaternary (Broadest):
NQUSB10 - Technology Sector
→ NVDA vs. entire technology sector
You can now zoom in to see direct competitors or zoom out to understand macro sector trends - all in one indicator!
━━━━━━━━━━━━━━━━━━━━━━━━━━━━━━━━━━━━━━━━
═══ COMPARISON SUMMARY ═══
Original Version:
- Comparison System: Industry ETFs
- Industry Levels: 1 (flat ETF mapping)
- Total Classifications: ~140 industries
- Hierarchy Navigation: ❌ No
- Data Source: Manual ETF curation
Improved Version:
- Comparison System: NQUSB Official Indices
- Industry Levels: 4 (hierarchical drill-down/up)
- Total Classifications: 361 NQUSB indices
- Hierarchy Navigation: ✅ 4-level drill navigation
- Data Source: NASDAQ official taxonomy
- Large/Mid Cap Option: ✅ LM variant toggle
- Level Indicator: ✅ [Index-L1] to [Index-L4] labels
━━━━━━━━━━━━━━━━━━━━━━━━━━━━━━━━━━━━━━━━
═══ ADDITIONAL FEATURES ═══
- Dual Comparison System - Toggle between ETF mode (original) and Index Benchmark mode (NQUSB hierarchy)
- Better Fallback Logic - Manual Override > NQUSB Index > ETF > SPY default
- Enhanced Display - 4-row information table with full NQUSB index description
- Backward Compatible - All original ETF mappings still work, existing charts won't break
- Large Mid Cap Toggle - Optional "LM" suffix for focusing on larger companies only
━━━━━━━━━━━━━━━━━━━━━━━━━━━━━━━━━━━━━━━━
For complete documentation, data files, technical details, and the full NQUSB hierarchy structure, visit the GitHub repository.
The result: More accurate, more flexible, and more comprehensive industry strength analysis - enabling traders to understand exactly where their stock's performance comes from by drilling through multiple levels of industry classification.
开源脚本
秉承TradingView的精神,该脚本的作者将其开源,以便交易者可以查看和验证其功能。向作者致敬!您可以免费使用该脚本,但请记住,重新发布代码须遵守我们的网站规则。
For complete documentation, Python automation scripts, and CSV data files used:
github.com/simsisim/tradingview_indicators
github.com/simsisim/tradingview_indicators
免责声明
这些信息和出版物并非旨在提供,也不构成TradingView提供或认可的任何形式的财务、投资、交易或其他类型的建议或推荐。请阅读使用条款了解更多信息。