OPEN-SOURCE SCRIPT
Polynomial Regression Slope [QTL]
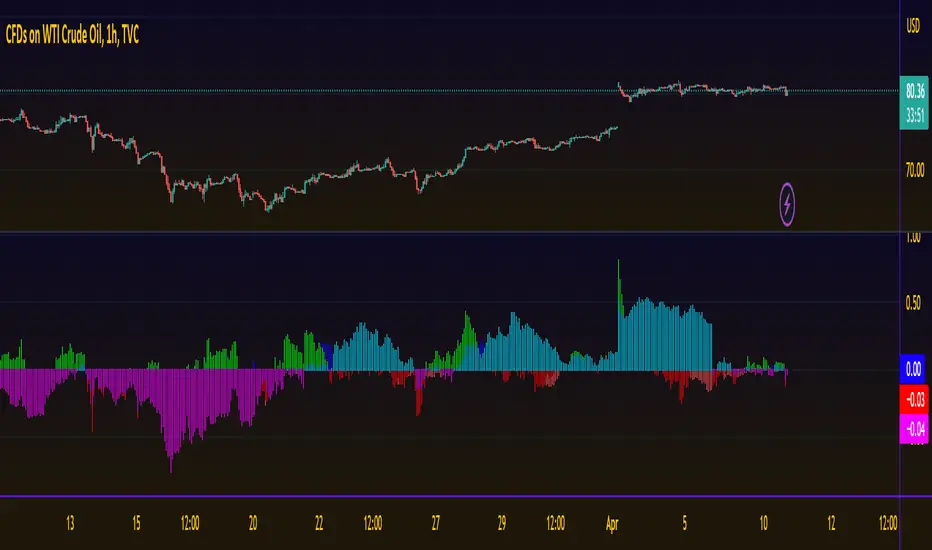
The Polynomial Regression Slope Indicator is a versatile and powerful tool for traders seeking to identify trends and potential entry or exit points in the market. By fitting a polynomial function to a dataset, this indicator can provide insights into the direction and strength of a trend over a specified time period. The indicator allows users to select the degree of the polynomial (1 for linear, 2 for quadratic, and 3 for cubic) to match their trading style and the characteristics of the market they are trading in.
While higher-degree polynomials can offer a better fit to the data, we recommend using a polynomial of degree less than 3 for the sake of stability and to avoid overfitting. Overfitting occurs when a model captures the noise in the data rather than the underlying trend, leading to false signals and decreased predictive power.
Slope is an important aspect of trading as it represents the rate of change of an asset's price over time. A positive slope indicates an upward trend, while a negative slope suggests a downward trend. By using the Polynomial Regression Slope Indicator, traders can better understand the current market dynamics, identify potential reversals or continuation patterns, and make informed decisions on when to enter or exit a position.
开源脚本
秉承TradingView的精神,该脚本的作者将其开源,以便交易者可以查看和验证其功能。向作者致敬!您可以免费使用该脚本,但请记住,重新发布代码须遵守我们的网站规则。
免责声明
这些信息和出版物并非旨在提供,也不构成TradingView提供或认可的任何形式的财务、投资、交易或其他类型的建议或推荐。请阅读使用条款了解更多信息。
开源脚本
秉承TradingView的精神,该脚本的作者将其开源,以便交易者可以查看和验证其功能。向作者致敬!您可以免费使用该脚本,但请记住,重新发布代码须遵守我们的网站规则。
免责声明
这些信息和出版物并非旨在提供,也不构成TradingView提供或认可的任何形式的财务、投资、交易或其他类型的建议或推荐。请阅读使用条款了解更多信息。