OPEN-SOURCE SCRIPT
Dline
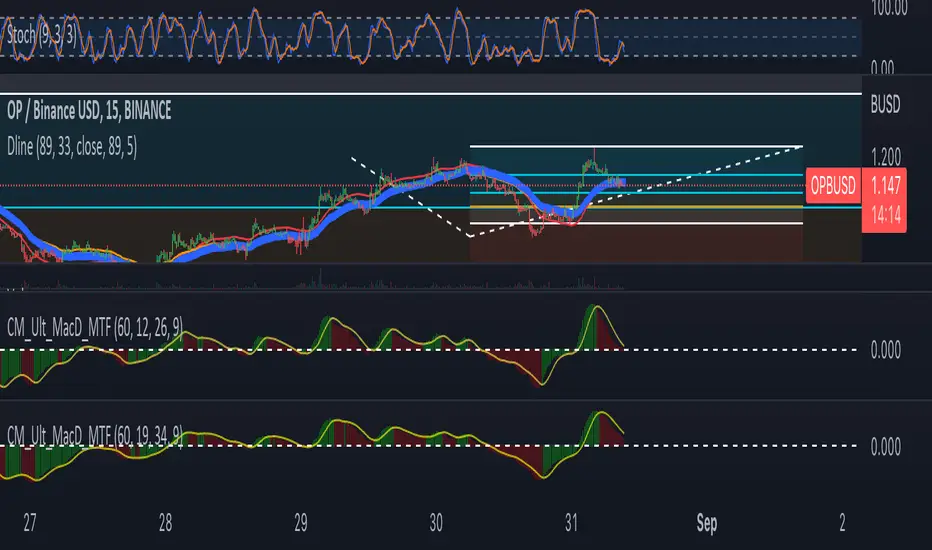
Dline is a indicator that was developed by B-Negative. This indicator was developed under convergence logic. If we have many information of prices, when the information was averaged with more enough, the average line will be the linear line that has direction. The direction of this linear line can help traders to analyze the direction of trends. Dline was made with TEMA, EMA, DEMA, and Dline line that is a average line between DEMA and EMA.
Under B-Negative's concept, DEMA and EMA that are average lines will convergence and have same direction when the trends are coming. Amount of data must more enough and diferrect by assets' type. However, user can change value of DEMA, Dline, EMA, and TEMA by themself under 7 concepts below.
1. EMA will convergence to close Dline when the trend will be changing.
2. The uptrend will occure when EMA above/below Dline and candle sticks are green/red color.
3. TEMA was setted similair DEMA.
4. When new high/low of wave cross TEMA and can not retrun to create higher/lower high/low (At oversold/overbought, Stocastic 9,3,3 counting with loop technique), that is exit point of position.
5. Difference of timeframe or assets could use different parameters. (Setting based on 4 rule above.)
6. Divergence between Dline and EMA mean sentiment of assets are sideways.
7. If Dline and EMA look like same line, the trend is most strength trend.
Dline use thickness = 4
EMA use thickness = 1
This ex. is timeframe day.
开源脚本
秉承TradingView的精神,该脚本的作者将其开源,以便交易者可以查看和验证其功能。向作者致敬!您可以免费使用该脚本,但请记住,重新发布代码须遵守我们的网站规则。
免责声明
这些信息和出版物并非旨在提供,也不构成TradingView提供或认可的任何形式的财务、投资、交易或其他类型的建议或推荐。请阅读使用条款了解更多信息。
开源脚本
秉承TradingView的精神,该脚本的作者将其开源,以便交易者可以查看和验证其功能。向作者致敬!您可以免费使用该脚本,但请记住,重新发布代码须遵守我们的网站规则。
免责声明
这些信息和出版物并非旨在提供,也不构成TradingView提供或认可的任何形式的财务、投资、交易或其他类型的建议或推荐。请阅读使用条款了解更多信息。