OPEN-SOURCE SCRIPT
MFI PRO
### MFI Indicator Guide
This guide provides a detailed explanation of the "MFI KriptoFun" indicator, which is designed for use on the TradingView platform. This custom script helps traders visualize significant changes in volume and price range through the use of graphical shapes plotted on the trading chart.
#### Indicator Description:
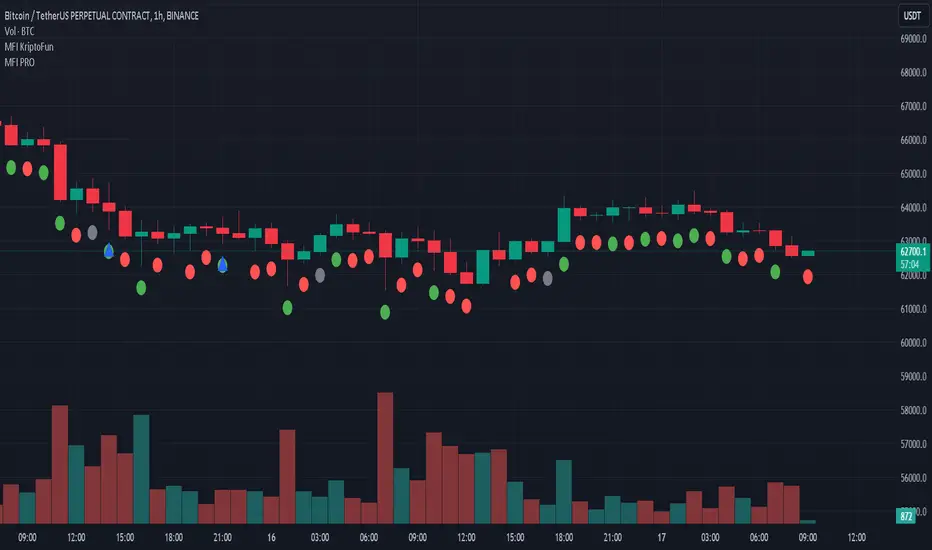
The "MFI KriptoFun" indicator plots different shapes (circles and triangles) on the chart to signify specific trading signals based on volume and price range dynamics. Each shape and color represents a unique market condition, aiding traders in making informed decisions.
#### Shapes and Colors:
1. Gray Circle: Indicates that the current price range is greater than the previous period's, but the volume has decreased and the percentage decrease in volume is more than 10% compared to the previous period.
2. Blue Circle: Plotted when there is an increase in volume by at least 10% compared to the previous period, while the price range has decreased.
3. Green Circle: Appears when both volume and price range have increased compared to the previous period.
4. Red Circle: Shows a decrease in both volume and price range compared to the previous period.
5. Blue Triangle: This shape is used to denote an increase in both volume and price range, with the closing and opening prices of the current period falling within the same third of the price range (lower, middle, or upper). Additionally, there must be a significant volume difference of at least 10%.
#### How to Use:
- Installation: To use this indicator, simply add it to your TradingView chart by copying the Pine Script code into the Pine Editor and adding it to your chart.
- Interpretation:
- Gray Circle: Caution may be warranted as decreasing volume with increasing price range could indicate weakening momentum.
- Blue Circle: Potential bullish signal if accompanied by other positive indicators.
- Green Circle: Strong bullish signal suggesting increasing buyer interest.
- Red Circle: Bearish signal indicating potential downward movement.
- Blue Triangle: Strong bullish signal, particularly if confirmed by additional analysis.
#### Settings:
The indicator does not have configurable settings through input options; however, users can modify the source code to adjust thresholds or conditions as per their trading strategy.
#### Conclusion:
The "MFI KriptoFun" indicator provides a visual representation of significant market movements, helping traders identify potential buy or sell opportunities based on volume and price action. As with all trading tools, it is recommended to use this indicator in conjunction with other analyses to validate trading signals.
This guide provides a detailed explanation of the "MFI KriptoFun" indicator, which is designed for use on the TradingView platform. This custom script helps traders visualize significant changes in volume and price range through the use of graphical shapes plotted on the trading chart.
#### Indicator Description:
The "MFI KriptoFun" indicator plots different shapes (circles and triangles) on the chart to signify specific trading signals based on volume and price range dynamics. Each shape and color represents a unique market condition, aiding traders in making informed decisions.
#### Shapes and Colors:
1. Gray Circle: Indicates that the current price range is greater than the previous period's, but the volume has decreased and the percentage decrease in volume is more than 10% compared to the previous period.
2. Blue Circle: Plotted when there is an increase in volume by at least 10% compared to the previous period, while the price range has decreased.
3. Green Circle: Appears when both volume and price range have increased compared to the previous period.
4. Red Circle: Shows a decrease in both volume and price range compared to the previous period.
5. Blue Triangle: This shape is used to denote an increase in both volume and price range, with the closing and opening prices of the current period falling within the same third of the price range (lower, middle, or upper). Additionally, there must be a significant volume difference of at least 10%.
#### How to Use:
- Installation: To use this indicator, simply add it to your TradingView chart by copying the Pine Script code into the Pine Editor and adding it to your chart.
- Interpretation:
- Gray Circle: Caution may be warranted as decreasing volume with increasing price range could indicate weakening momentum.
- Blue Circle: Potential bullish signal if accompanied by other positive indicators.
- Green Circle: Strong bullish signal suggesting increasing buyer interest.
- Red Circle: Bearish signal indicating potential downward movement.
- Blue Triangle: Strong bullish signal, particularly if confirmed by additional analysis.
#### Settings:
The indicator does not have configurable settings through input options; however, users can modify the source code to adjust thresholds or conditions as per their trading strategy.
#### Conclusion:
The "MFI KriptoFun" indicator provides a visual representation of significant market movements, helping traders identify potential buy or sell opportunities based on volume and price action. As with all trading tools, it is recommended to use this indicator in conjunction with other analyses to validate trading signals.
开源脚本
秉承TradingView的精神,该脚本的作者将其开源,以便交易者可以查看和验证其功能。向作者致敬!您可以免费使用该脚本,但请记住,重新发布代码须遵守我们的网站规则。
免责声明
这些信息和出版物并非旨在提供,也不构成TradingView提供或认可的任何形式的财务、投资、交易或其他类型的建议或推荐。请阅读使用条款了解更多信息。
免责声明
这些信息和出版物并非旨在提供,也不构成TradingView提供或认可的任何形式的财务、投资、交易或其他类型的建议或推荐。请阅读使用条款了解更多信息。