INVITE-ONLY SCRIPT
Support Resistance Weekly Bars - Repost (website issue)

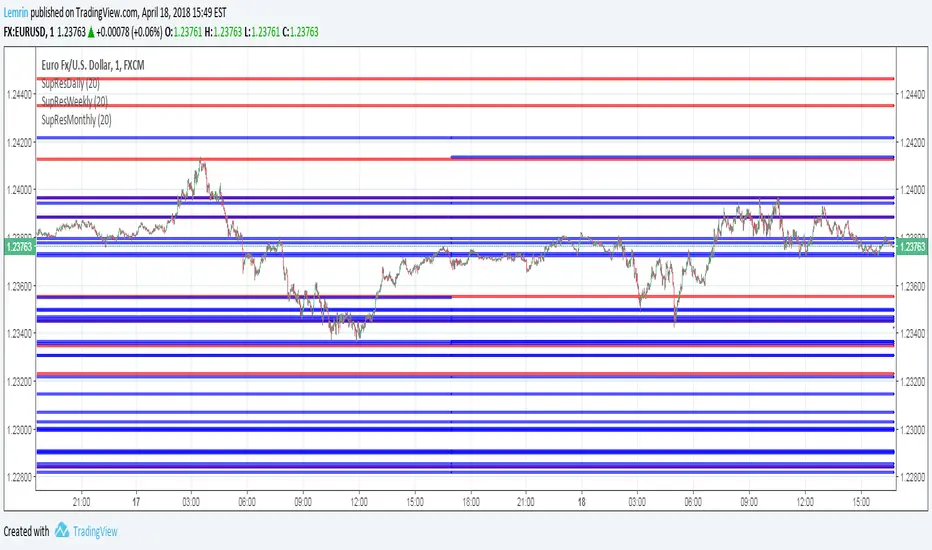
This indicator plots horizontal lines for the high and low of each of the last x weeks (configurable from 1 to 20). Increasing this number beyond 20 is not possible due to some technical Pine limitations. I am also publishing a daily and monthly version...add them all to the same chart! Written for TV user: kvpatel
Reposting because something broke, and the first version is no longer available in my list of scripts to update (needed to fix a bug).
Reposting because something broke, and the first version is no longer available in my list of scripts to update (needed to fix a bug).
免责声明
这些信息和出版物并非旨在提供,也不构成TradingView提供或认可的任何形式的财务、投资、交易或其他类型的建议或推荐。请阅读使用条款了解更多信息。