INVITE-ONLY SCRIPT
Mayfair Supply & Demand Zones 1.0
Identifying Supply and Demand zones can be tricky.
Just using price levels can mislead you, so why not include volume ramps to detect zones?
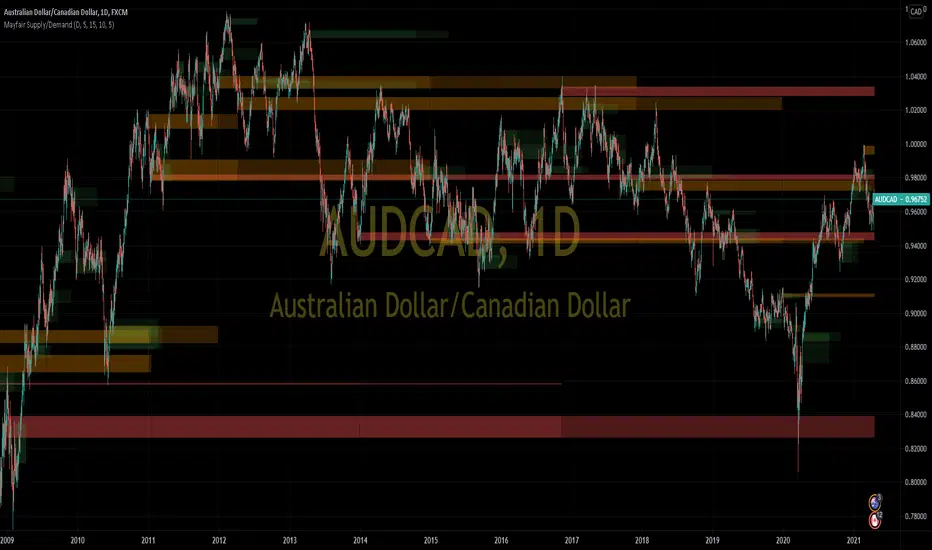
This indicator does it for you. It spots areas where volume has rapidly increased, measures the speed of the increase, and assigns three different levels of importance.
The red areas are the strongest zones, followed by amber, then green, like a traffic light.
The red areas are persisted longer than the amber, which are persisted longer than the green. As the persistence fades, the colour of the zone fades as well.
It is possible to set the levels of all three volume thresholds to suit yourself, as well as the lookback period the script uses to detect volume increases.
In this chart, only very large volume increases are used:

As you can see, the bands are narrower, but we feel the defaults give the best results.
Just using price levels can mislead you, so why not include volume ramps to detect zones?
This indicator does it for you. It spots areas where volume has rapidly increased, measures the speed of the increase, and assigns three different levels of importance.
The red areas are the strongest zones, followed by amber, then green, like a traffic light.
The red areas are persisted longer than the amber, which are persisted longer than the green. As the persistence fades, the colour of the zone fades as well.
It is possible to set the levels of all three volume thresholds to suit yourself, as well as the lookback period the script uses to detect volume increases.
In this chart, only very large volume increases are used:
As you can see, the bands are narrower, but we feel the defaults give the best results.
仅限邀请脚本
仅限作者授权的用户访问此脚本,并且通常需要付费。您可以将其添加到收藏中,但是只有在向作者请求并获得许可之后,才能使用它。 请联系Paul_Varcoe了解更多信息,或按照以下作者的说明操作。
TradingView不建议付费使用脚本,除非您100%信任作者并了解脚本的工作原理。在许多情况下,您可以在我们的社区脚本免费找到不错的开源替代方案。
作者的说明
″To buy this script please go to https://launchpass.com/mayfair-trading-and-mentoring/supply-and-demand
The script is quite CPU heavy, so it's best to hide it temporarily when scrolling or otherwise moving the chart
想在图表上使用此脚本?
警告:请在申请访问权限之前阅读。
免责声明
这些信息和出版物并不意味着也不构成TradingView提供或认可的金融、投资、交易或其它类型的建议或背书。请在使用条款阅读更多信息。