OPEN-SOURCE SCRIPT
Custom Support & Resistance Levels (Manual Input)
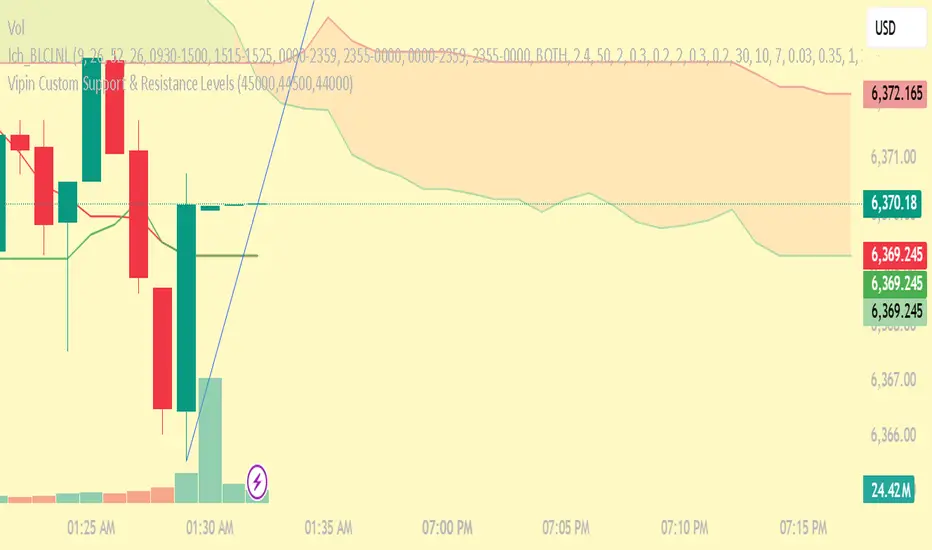
This indicator lets you plot your own support levels (and can be extended for resistance) directly on the chart by entering them as comma-separated values.
📌 Supports manual input for multiple price levels.
📊 Lines are extended across the chart for clear visualization.
🎨 Dynamic coloring:
Green if the current price is above the level.
Red if the current price is below the level.
🧹 Old lines are automatically cleared to avoid clutter.
This tool is ideal if you:
Prefer to mark your own key zones instead of relying only on auto-detected levels.
Want clean and simple visualization of critical price areas.
👉 Coming soon: Resistance levels input (commented in the code, can be enabled).
开源脚本
秉承TradingView的精神,该脚本的作者将其开源,以便交易者可以查看和验证其功能。向作者致敬!您可以免费使用该脚本,但请记住,重新发布代码须遵守我们的网站规则。
免责声明
这些信息和出版物并非旨在提供,也不构成TradingView提供或认可的任何形式的财务、投资、交易或其他类型的建议或推荐。请阅读使用条款了解更多信息。
开源脚本
秉承TradingView的精神,该脚本的作者将其开源,以便交易者可以查看和验证其功能。向作者致敬!您可以免费使用该脚本,但请记住,重新发布代码须遵守我们的网站规则。
免责声明
这些信息和出版物并非旨在提供,也不构成TradingView提供或认可的任何形式的财务、投资、交易或其他类型的建议或推荐。请阅读使用条款了解更多信息。