OPEN-SOURCE SCRIPT
已更新 Volatility Adjusted Momentum Signal ETH (VAMS)
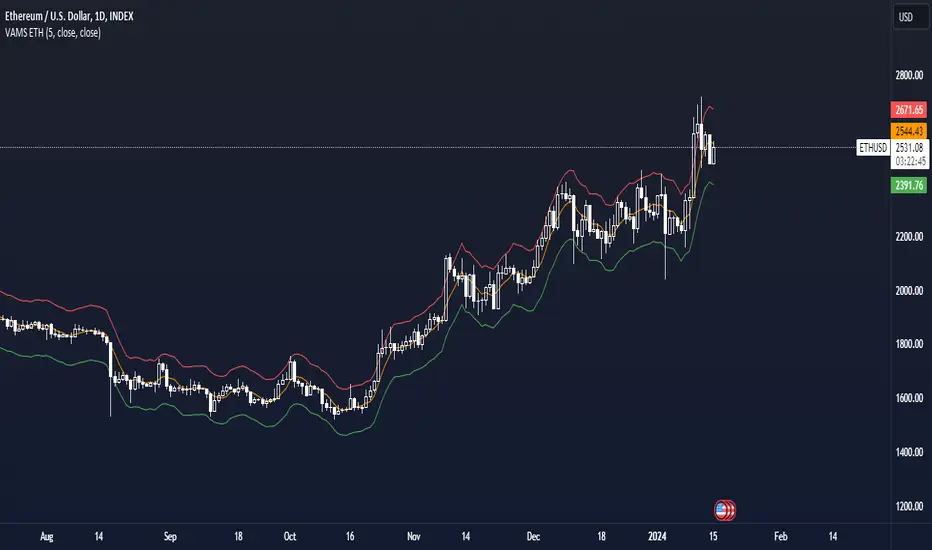
The VAMS ETH indicator is a technical analysis tool designed for Ethereum that aims to provide traders with insights into potential price momentum based on volatility-adjusted price ranges. This indicator is especially useful for identifying periods where the price is likely to experience significant movements away from a defined mean price level.
Key Functions
Volatility Measurement It utilizes a short-term lookback period to measure volatility, calculated as the standard deviation of the closing prices over the user-defined period.
Mean Price Calculation
Simultaneously, it computes the average closing price over the same lookback period to establish a baseline for the current price.
Probable Range Estimation
Using predefined mean percentage changes, the indicator calculates upper and lower boundaries that represent the probable range for price movements. These boundaries are adjusted for volatility, providing a dynamic perspective on where the price is in relation to typical fluctuations.
Signal Visualization
The lower and upper boundaries are plotted on the chart, color-coded in green and red, respectively. These plots help visualize zones where the price might be considered overextended or undervalued based on recent volatility.
The VAMS indicator allows for customization of the lookback period, enabling traders to adjust the sensitivity of the volatility measurement to match their trading style.
版本注释
Added plot for the mean priceAdded input for the source of the mean price and volatility
版本注释
Cleaned script code开源脚本
秉承TradingView的精神,该脚本的作者将其开源,以便交易者可以查看和验证其功能。向作者致敬!您可以免费使用该脚本,但请记住,重新发布代码须遵守我们的网站规则。
🔍 Access Investing Strategies & Indicators
📊 whop.com/marktquant
🌐 marktquant.com
Nothing shared on this page constitutes financial advice. All information, tools, and analyses are provided solely for informational and educational purposes.
📊 whop.com/marktquant
🌐 marktquant.com
Nothing shared on this page constitutes financial advice. All information, tools, and analyses are provided solely for informational and educational purposes.
免责声明
这些信息和出版物并非旨在提供,也不构成TradingView提供或认可的任何形式的财务、投资、交易或其他类型的建议或推荐。请阅读使用条款了解更多信息。
开源脚本
秉承TradingView的精神,该脚本的作者将其开源,以便交易者可以查看和验证其功能。向作者致敬!您可以免费使用该脚本,但请记住,重新发布代码须遵守我们的网站规则。
🔍 Access Investing Strategies & Indicators
📊 whop.com/marktquant
🌐 marktquant.com
Nothing shared on this page constitutes financial advice. All information, tools, and analyses are provided solely for informational and educational purposes.
📊 whop.com/marktquant
🌐 marktquant.com
Nothing shared on this page constitutes financial advice. All information, tools, and analyses are provided solely for informational and educational purposes.
免责声明
这些信息和出版物并非旨在提供,也不构成TradingView提供或认可的任何形式的财务、投资、交易或其他类型的建议或推荐。请阅读使用条款了解更多信息。