OPEN-SOURCE SCRIPT
Failed 2U/2D + 50% Retrace Scanner
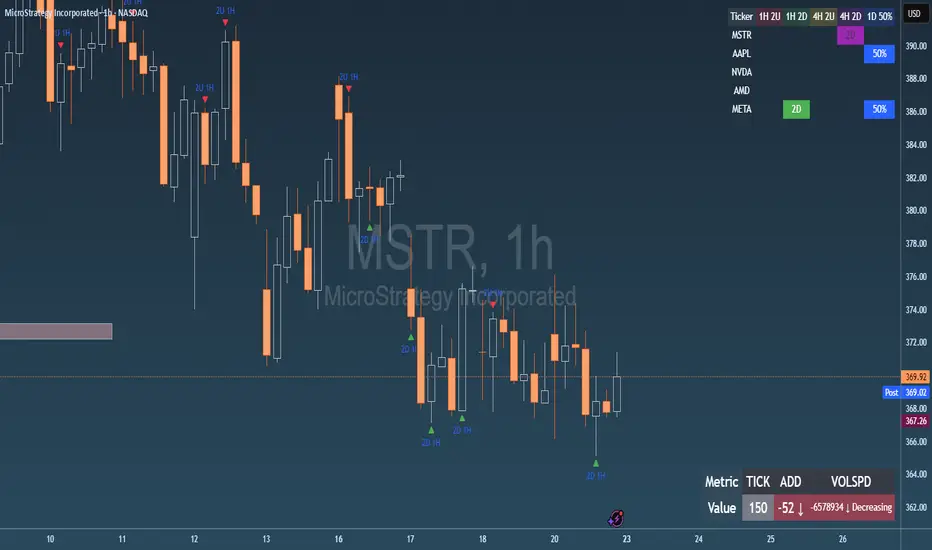
📈 Multi-Ticker Failed 2U/2D Scanner with Daily Retrace & Market Breadth Table
This TradingView indicator is a multi-symbol price action scanner designed to catch high-probability reversal signals using The Strat’s failed 2U/2D patterns and daily 50% retrace logic, while also displaying market breadth metrics ( TICK and ADD) for context.
Monitored Symbols:
SPY, SPX, QQQ, IWM, NVDA, AMD, AAPL, META, MSTR
🔍 Detection Logic
1. Failed 2U / Failed 2D Setups
Failed 2U: Price breaks above the previous candle’s high but closes back below the open → Bearish reversal
Failed 2D: Price breaks below the previous candle’s low but closes back above the open → Bullish reversal
Timeframes Monitored:
🕐 1-Hour (1H)
⏰ 4-Hour (4H)
2. Daily 50% Candle Retrace
Checks if price has retraced 50% or more of the previous day’s candle body
Highlights potential trend exhaustion or reversal confluence
3. Market Breadth Metrics (Display Only)
TICK: Measures real-time NYSE up vs. down ticks
ADD: Advance-Decline Line (net advancing stocks)
Not used in signal logic — just displayed in the table for overall market context
🖼️ Visual Elements
✅ Chart Markers
🔺 Red/Green Arrows for 1H Failed 2U/2D
🟨 Yellow Squares for 4H Failed 2U/2D
Visual markers are plotted directly on the relevant candles
📊 Signal Table
Lists all 9 tickers in rows
Columns for:
1H Signal
4H Signal
Daily 50% Retrace
TICK Value
ADD Value
Color-Coded Cells:
🔴 Red = Failed 2U
🟢 Green = Failed 2D
⚠️ Highlight if 50% Daily Retrace condition is true
🟦 Neutral-colored cells for TICK/ADD numeric display
🔔 Alerts
Hardcoded alerts fire when:
A 1H or 4H Failed 2U/2D is detected
The Daily 50% retrace condition is met
Each alert is labeled clearly by symbol and timeframe:
"META 4H Failed 2D"
"AAPL Daily 50% Retrace"
🎯 Use Case
Built for:
Reversal traders using The Strat
Swing or intraday traders watching hourly setups
Traders wanting quick visual context on market breadth without relying on it for confirmation
Monitoring multiple tickers in one clean view
This is scan 2
Add scan 1 for spx, spy, iwm, qqq, aapl
This indicator is not financial advice. Use the alerts to check out chart and when tickers trigger.
This TradingView indicator is a multi-symbol price action scanner designed to catch high-probability reversal signals using The Strat’s failed 2U/2D patterns and daily 50% retrace logic, while also displaying market breadth metrics (
Monitored Symbols:
SPY, SPX, QQQ, IWM, NVDA, AMD, AAPL, META, MSTR
🔍 Detection Logic
1. Failed 2U / Failed 2D Setups
Failed 2U: Price breaks above the previous candle’s high but closes back below the open → Bearish reversal
Failed 2D: Price breaks below the previous candle’s low but closes back above the open → Bullish reversal
Timeframes Monitored:
🕐 1-Hour (1H)
⏰ 4-Hour (4H)
2. Daily 50% Candle Retrace
Checks if price has retraced 50% or more of the previous day’s candle body
Highlights potential trend exhaustion or reversal confluence
3. Market Breadth Metrics (Display Only)
Not used in signal logic — just displayed in the table for overall market context
🖼️ Visual Elements
✅ Chart Markers
🔺 Red/Green Arrows for 1H Failed 2U/2D
🟨 Yellow Squares for 4H Failed 2U/2D
Visual markers are plotted directly on the relevant candles
📊 Signal Table
Lists all 9 tickers in rows
Columns for:
1H Signal
4H Signal
Daily 50% Retrace
Color-Coded Cells:
🔴 Red = Failed 2U
🟢 Green = Failed 2D
⚠️ Highlight if 50% Daily Retrace condition is true
🟦 Neutral-colored cells for TICK/ADD numeric display
🔔 Alerts
Hardcoded alerts fire when:
A 1H or 4H Failed 2U/2D is detected
The Daily 50% retrace condition is met
Each alert is labeled clearly by symbol and timeframe:
"META 4H Failed 2D"
"AAPL Daily 50% Retrace"
🎯 Use Case
Built for:
Reversal traders using The Strat
Swing or intraday traders watching hourly setups
Traders wanting quick visual context on market breadth without relying on it for confirmation
Monitoring multiple tickers in one clean view
This is scan 2
Add scan 1 for spx, spy, iwm, qqq, aapl
This indicator is not financial advice. Use the alerts to check out chart and when tickers trigger.
开源脚本
秉承TradingView的精神,该脚本的作者将其开源,以便交易者可以查看和验证其功能。向作者致敬!您可以免费使用该脚本,但请记住,重新发布代码须遵守我们的网站规则。
免责声明
这些信息和出版物并非旨在提供,也不构成TradingView提供或认可的任何形式的财务、投资、交易或其他类型的建议或推荐。请阅读使用条款了解更多信息。
开源脚本
秉承TradingView的精神,该脚本的作者将其开源,以便交易者可以查看和验证其功能。向作者致敬!您可以免费使用该脚本,但请记住,重新发布代码须遵守我们的网站规则。
免责声明
这些信息和出版物并非旨在提供,也不构成TradingView提供或认可的任何形式的财务、投资、交易或其他类型的建议或推荐。请阅读使用条款了解更多信息。