OPEN-SOURCE SCRIPT
已更新 Gann Circle Intraday Levels
This indicator is an intraday version of Gann Circle Swing Levels indicator. It further divides the Gann Circle into the Eighths in order to generate intraday Levels.
Introduction
This indicator is based on W. D. Gann's Square of 9 Chart and can be interpreted as the Gann Circle / Gann Wheel / 360 Degree Circle Chart or Square of the Circle Chart for intraday usage.
Spiral arrangement of numbers on the Square of 9 chart creates a very unique square root relationship amongst the numbers on the chart. If you take any number on the Square of 9 chart, take the square root of the number, then add 2 to the root and re-square it, resulting in one full 360 degree cycle (i.e. a 360 degree Circle) out from the center of the chart.
For example,
the square root of 121 = 11,
11 + 2 = 13,
and the square of 13 = 169
The number 169 is one full 360 degree cycle out (with reference to 121) from the center of the Square of 9 chart. If we further divide the circle in eight equal parts of 45 degree each, following intermediate resistance levels (ascending) would be generated:
127 (45 degree)
133 (90 degree)
139 (135 degree)
145 (180 degree)
151 (225 degree)
157 (270 degree)
163 (315 degree)
Similarly, if you take any number on the Square of 9 chart, take the square root of the number, then subtract 2 from the root and re-square it, resulting in one full 360 degree inward rotation towards the center of the chart.
For example,
the square root of 565 = 23.77,
23.77 - 2 = 21.77,
and the square of 21.77 = 473.93 (approximately equal to 474, which is directly below 565 on the Square of 9 chart)
The number 474 is one full 360 degree inward rotation (with reference to 565) towards the center of the chart. If we further divide the circle in eight equal parts of 45 degree each, following intermediate support levels (descending) would be generated:
553 (45 degree)
541 (90 degree)
529 (135 degree)
518 (180 degree)
507 (225 degree)
496 (270 degree)
485 (315 degree)
How to Use this Indicator ?
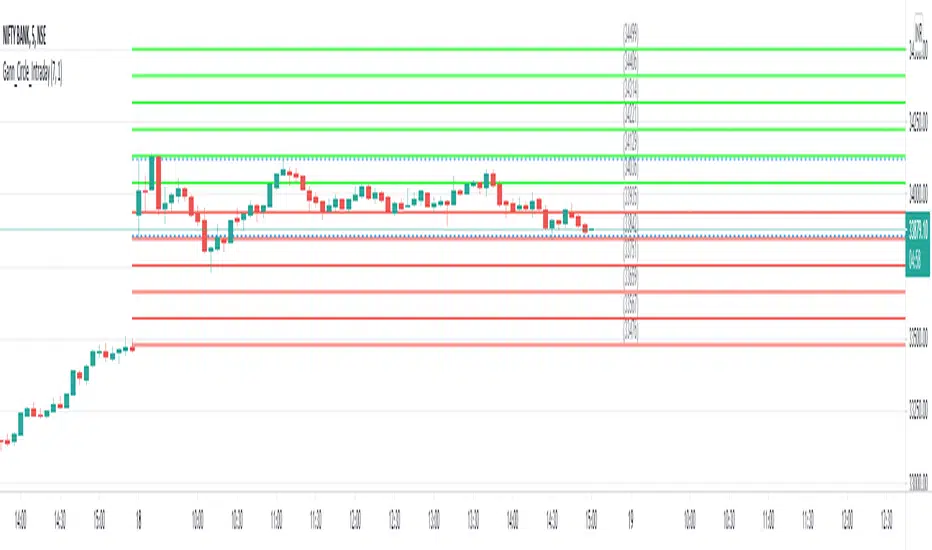
This indicator is designed to generate Gann Circle Intraday Levels based on HIGH and LOW of the opening bar for the day. You may use the bar interval (1 minute, 3 minutes, 5 minutes, 15 minutes etc.) which is suitable for the underlying instrument. Support and resistance lines for the day would be generated only after confirmation of the opening bar of the day.
Input :
Output :
Gann Support or Resistance Levels:
Introduction
This indicator is based on W. D. Gann's Square of 9 Chart and can be interpreted as the Gann Circle / Gann Wheel / 360 Degree Circle Chart or Square of the Circle Chart for intraday usage.
Spiral arrangement of numbers on the Square of 9 chart creates a very unique square root relationship amongst the numbers on the chart. If you take any number on the Square of 9 chart, take the square root of the number, then add 2 to the root and re-square it, resulting in one full 360 degree cycle (i.e. a 360 degree Circle) out from the center of the chart.
For example,
the square root of 121 = 11,
11 + 2 = 13,
and the square of 13 = 169
The number 169 is one full 360 degree cycle out (with reference to 121) from the center of the Square of 9 chart. If we further divide the circle in eight equal parts of 45 degree each, following intermediate resistance levels (ascending) would be generated:
127 (45 degree)
133 (90 degree)
139 (135 degree)
145 (180 degree)
151 (225 degree)
157 (270 degree)
163 (315 degree)
Similarly, if you take any number on the Square of 9 chart, take the square root of the number, then subtract 2 from the root and re-square it, resulting in one full 360 degree inward rotation towards the center of the chart.
For example,
the square root of 565 = 23.77,
23.77 - 2 = 21.77,
and the square of 21.77 = 473.93 (approximately equal to 474, which is directly below 565 on the Square of 9 chart)
The number 474 is one full 360 degree inward rotation (with reference to 565) towards the center of the chart. If we further divide the circle in eight equal parts of 45 degree each, following intermediate support levels (descending) would be generated:
553 (45 degree)
541 (90 degree)
529 (135 degree)
518 (180 degree)
507 (225 degree)
496 (270 degree)
485 (315 degree)
How to Use this Indicator ?
This indicator is designed to generate Gann Circle Intraday Levels based on HIGH and LOW of the opening bar for the day. You may use the bar interval (1 minute, 3 minutes, 5 minutes, 15 minutes etc.) which is suitable for the underlying instrument. Support and resistance lines for the day would be generated only after confirmation of the opening bar of the day.
Input :
- Number of Gann Levels (Number of Gann Levels to be projected)
- Color codes for the Support and Resistance Levels
Output :
Gann Support or Resistance Levels:
- HIGH and LOW of the Opening bar for the day (dashed BLUE lines)
- Support levels calculated with reference to the HIGH of the opening bar
- Resistance levels calculated with reference to the LOW of the opening bar
版本注释
Usability changes. Configurable colors for Support and Resistance Levels. Adjustable label position. 开源脚本
秉承TradingView的精神,该脚本的作者将其开源,以便交易者可以查看和验证其功能。向作者致敬!您可以免费使用该脚本,但请记住,重新发布代码须遵守我们的网站规则。
免责声明
这些信息和出版物并非旨在提供,也不构成TradingView提供或认可的任何形式的财务、投资、交易或其他类型的建议或推荐。请阅读使用条款了解更多信息。
免责声明
这些信息和出版物并非旨在提供,也不构成TradingView提供或认可的任何形式的财务、投资、交易或其他类型的建议或推荐。请阅读使用条款了解更多信息。