OPEN-SOURCE SCRIPT
已更新 Pivot Point Target Prices [SS]
Hey everyone,
Back with another indicator!
I have been trying to do this indicator for like months (over 6 months). I gave up on it a few times and then finally reapproached it in a different way and was able to get it working successfully!
This is the pivot point target price indicator, let's get into how it works!
How it works:
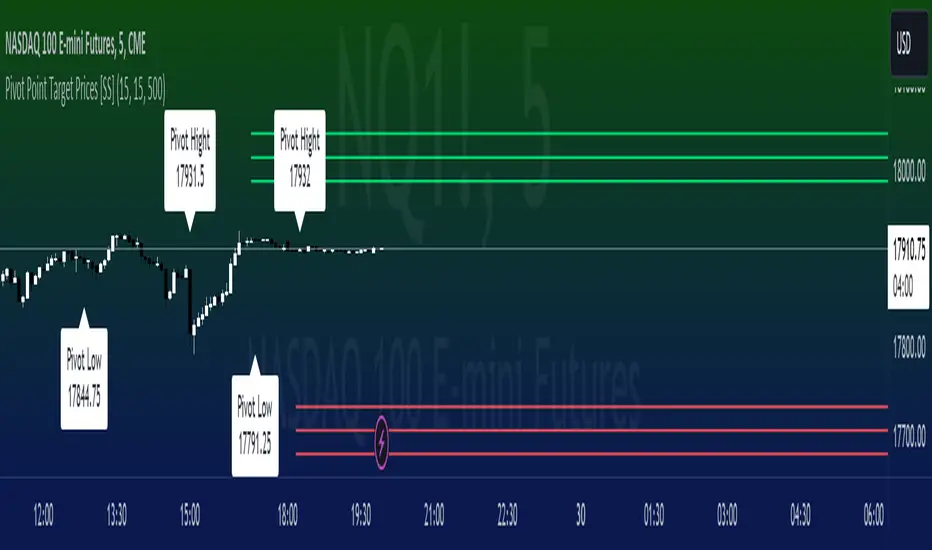
The indicator keeps track of previous pivot highs and lows within your designated lookback timeframe. Using this data, it calculates the average difference between the pivot highs and pivot lows to give you an ATR range.
In addition to this, it tracks the standard deviation of this range. This allows the indicator to give us 3 price targets, 2 standard deviations below the anticipated target, the anticipated target (middle value) and 2 standard deviations above the anticipated target.
Here is a diagram:

I usually only look for the first target, which is the -2 standard deviation below the actual target, but having the added 2 gives some buffer room if a stock is particularly bullish or bearish.
How to use it:
You use this the same way you would pivot points, the only difference is this will show you target ranges to look for on a pivot low or pivot high.
There is some customizability, which I will explain below:
Customize bars: You have the ability to customize left and right bars for your pivot points. I personally like 15 and 15 but I know the most commonly used are 10 and 10.
ATR Length: The ATR Length is defaulted at 500. If you want to tighten up the length and give more conservative targets, you can shorten to between 75 and 150. If you want to be very aggressive with the targets, you can extend to 750 to 1,000.
Toggle on/off labels: You can choose to turn off the pivot labels if you wish.
Important note:
Many pivot indicators will show you pivot levels and use these as support and resistance. This indicator isn't doing that. Its combining ATR and Pivot Points. The ATR gives us the price targets by calculating the average range between pivot highs and pivot lows, and the pivot points are operating as usual.
And that's the indicator!
I hope you enjoy it, like I said it took me forever to get a functioning version of this, so hope you find it helpful!
Safe trades everyone!
Back with another indicator!
I have been trying to do this indicator for like months (over 6 months). I gave up on it a few times and then finally reapproached it in a different way and was able to get it working successfully!
This is the pivot point target price indicator, let's get into how it works!
How it works:
The indicator keeps track of previous pivot highs and lows within your designated lookback timeframe. Using this data, it calculates the average difference between the pivot highs and pivot lows to give you an ATR range.
In addition to this, it tracks the standard deviation of this range. This allows the indicator to give us 3 price targets, 2 standard deviations below the anticipated target, the anticipated target (middle value) and 2 standard deviations above the anticipated target.
Here is a diagram:
I usually only look for the first target, which is the -2 standard deviation below the actual target, but having the added 2 gives some buffer room if a stock is particularly bullish or bearish.
How to use it:
You use this the same way you would pivot points, the only difference is this will show you target ranges to look for on a pivot low or pivot high.
There is some customizability, which I will explain below:
Customize bars: You have the ability to customize left and right bars for your pivot points. I personally like 15 and 15 but I know the most commonly used are 10 and 10.
ATR Length: The ATR Length is defaulted at 500. If you want to tighten up the length and give more conservative targets, you can shorten to between 75 and 150. If you want to be very aggressive with the targets, you can extend to 750 to 1,000.
Toggle on/off labels: You can choose to turn off the pivot labels if you wish.
Important note:
Many pivot indicators will show you pivot levels and use these as support and resistance. This indicator isn't doing that. Its combining ATR and Pivot Points. The ATR gives us the price targets by calculating the average range between pivot highs and pivot lows, and the pivot points are operating as usual.
And that's the indicator!
I hope you enjoy it, like I said it took me forever to get a functioning version of this, so hope you find it helpful!
Safe trades everyone!
版本注释
A little spelling error that needed to be fixed!开源脚本
秉承TradingView的精神,该脚本的作者将其开源,以便交易者可以查看和验证其功能。向作者致敬!您可以免费使用该脚本,但请记住,重新发布代码须遵守我们的网站规则。
Get:
- Live Updates,
- Discord access,
- Access to my Proprietary Merlin Software,
- Access to premium indicators,
patreon.com/steversteves
Now on X!
- Live Updates,
- Discord access,
- Access to my Proprietary Merlin Software,
- Access to premium indicators,
patreon.com/steversteves
Now on X!
免责声明
这些信息和出版物并非旨在提供,也不构成TradingView提供或认可的任何形式的财务、投资、交易或其他类型的建议或推荐。请阅读使用条款了解更多信息。
开源脚本
秉承TradingView的精神,该脚本的作者将其开源,以便交易者可以查看和验证其功能。向作者致敬!您可以免费使用该脚本,但请记住,重新发布代码须遵守我们的网站规则。
Get:
- Live Updates,
- Discord access,
- Access to my Proprietary Merlin Software,
- Access to premium indicators,
patreon.com/steversteves
Now on X!
- Live Updates,
- Discord access,
- Access to my Proprietary Merlin Software,
- Access to premium indicators,
patreon.com/steversteves
Now on X!
免责声明
这些信息和出版物并非旨在提供,也不构成TradingView提供或认可的任何形式的财务、投资、交易或其他类型的建议或推荐。请阅读使用条款了解更多信息。