PROTECTED SOURCE SCRIPT
Liquidation Zone [Pt]

[SIZE=4]█ Introduction[/SIZE]
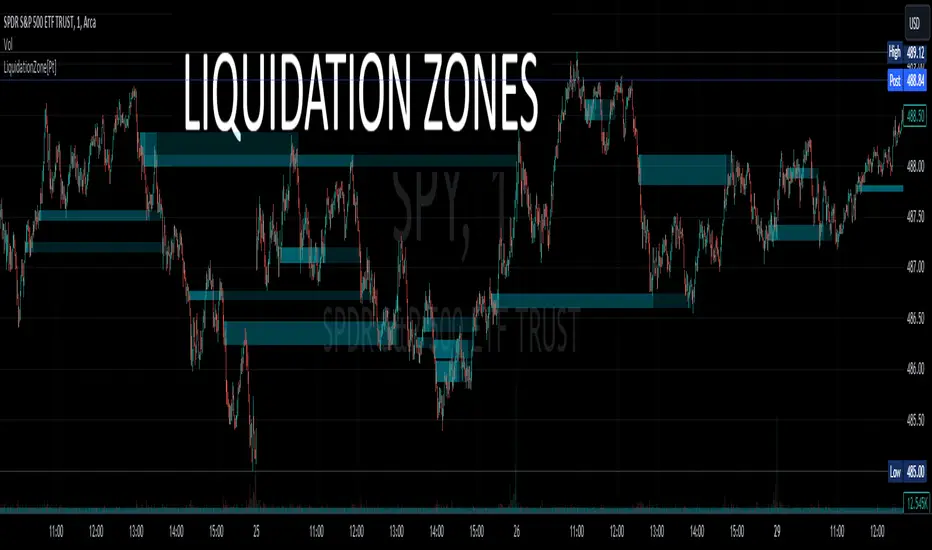
The [B]Liquidation Zone [Pt][/B] indicator is designed to identify key price ranges where significant market activity, such as the liquidation of positions, is likely to occur. These zones are identified based on a specific candlestick pattern, offering insights into potential areas of market sensitivity.
[SIZE=4][B]█ Key Features:[/B][/SIZE]
► [B]Specific Candlestick Pattern Identification:[/B] The indicator identifies liquidation zones by detecting a pattern where a red candle is encased within a series of green candles (in bullish scenarios) or a green candle within red candles (in bearish scenarios). This pattern often suggests a point where the market pauses to liquidate positions before continuing the prevailing trend.
► [B]Market Reaction Points:[/B] These liquidation zones represent significant levels where the market previously decided to liquidate or adjust positions, indicating potential areas where price might react upon revisit.
► [B]Integration with Volatility and Volume Data:[/B] The script combines these candlestick patterns with volatility (using ATR) and volume data, adding depth to the analysis and increasing the reliability of these zones as potential reaction areas.
► [B]Visual Zone Mapping on Charts:[/B] Liquidation Zones are clearly marked on the trading chart for easy identification, aiding traders in visualizing these critical market areas.
[SIZE=4][B]█ Possible Use Cases[/B][/SIZE]
[SIZE=3][B]► Identifying Potential Reaction Areas[/B][/SIZE]
Traders can use the [B]Liquidation Zone[/B] indicator to pinpoint zones where the market might pause or reverse due to previous liquidation activities. These areas can be key for planning entries, exits, or expecting increased market volatility.
[SIZE=3][B]► Enhancing Trading Strategy[/B][/SIZE]
Incorporating the analysis of liquidation zones into a trading strategy allows for a more nuanced understanding of market behavior, particularly in recognizing potential areas where price might experience significant support or resistance.
[SIZE=3][B]► Complementing Technical Analysis[/B][/SIZE]
This indicator is a valuable addition to a technical analyst's toolkit. When used alongside other analysis tools, it provides a more comprehensive view of the market, enhancing decision-making and strategy formulation.
受保护脚本
此脚本以闭源形式发布。 但是,您可以自由使用,没有任何限制 — 了解更多信息这里。
Purchases / Subscriptions / Support - buymeacoffee.com/ptgambler
PayPal - paypal.me/PtGambler
You can reach me privately through my Discord Channel: discord.gg/WMQfaVGyQC
PayPal - paypal.me/PtGambler
You can reach me privately through my Discord Channel: discord.gg/WMQfaVGyQC
免责声明
这些信息和出版物并非旨在提供,也不构成TradingView提供或认可的任何形式的财务、投资、交易或其他类型的建议或推荐。请阅读使用条款了解更多信息。