PROTECTED SOURCE SCRIPT
已更新 Tweezer Scanner

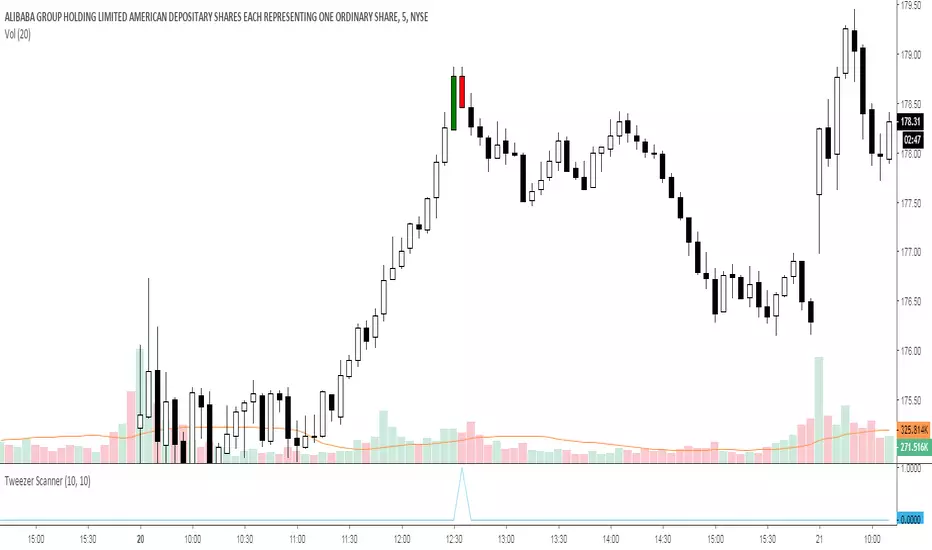
This indicator highlights the tweezer tops and tweezer bottoms on the chart it is applied on.
Per the definition, a tweezer top is a candlestick pattern in which the first candle is bullish, the second one is bearish and they have the same high. Other traders define a tweezer top using the close of the first candle and the open of the second one, but the indicator currently supports only comparison based on the high of these candles. Future updates might contain support for the alternative definition of a tweezer top, if requested.
Per the definition, a tweezer bottom is a candlestick pattern in which the first candle is bearish, the second one is bullish and they have the same low. Other traders define a tweezer bottom using the close of the first candle and the open of the second one, but the indicator currently supports only comparison based on the low of these candles. Future updates might contain support for the alternative definition of a tweezer bottom, if requested.
By default, the indicator requires that the tweezer top is also a pivot high, and the tweezer bottom is also a pivot low. These options can be disabled in the Settings panel of the indicator. The indicator scans for a customizable number of candles to the left and to the right of the potential pivot.
The plot line contains both upward and downward spikes, depending on the type of tweezers the indicator finds. It is useful when the chart is zoomed out and the colored candles cannot be easily seen.
版本注释
The settings panel has been simplified. There is now a single option for choosing whether the tweezers need to be pivots, in order for them to be highlighted, and the number of candles that are scanned to the left and right, for finding pivots. By default, the first option is disabled in this version, so the indicator will show all the tweezers. The tweezers are highlighted also in real-time, if the option "Tweezers must be pivots" is disabled or the "Pivot scanning area size" is 0. The reason is that the specified number of candles need to be created to the left and to the right of the tweezer, so that the indicator is able to decide whether the found tweezer is a pivot or not.The current version also includes a few bug fixes regarding the pivot scanning and the position of the plot spikes.
受保护脚本
此脚本以闭源形式发布。 但是,您可以自由使用,没有任何限制 — 了解更多信息这里。
免责声明
这些信息和出版物并非旨在提供,也不构成TradingView提供或认可的任何形式的财务、投资、交易或其他类型的建议或推荐。请阅读使用条款了解更多信息。
受保护脚本
此脚本以闭源形式发布。 但是,您可以自由使用,没有任何限制 — 了解更多信息这里。
免责声明
这些信息和出版物并非旨在提供,也不构成TradingView提供或认可的任何形式的财务、投资、交易或其他类型的建议或推荐。请阅读使用条款了解更多信息。