OPEN-SOURCE SCRIPT
已更新 Multiple Indicators Screener
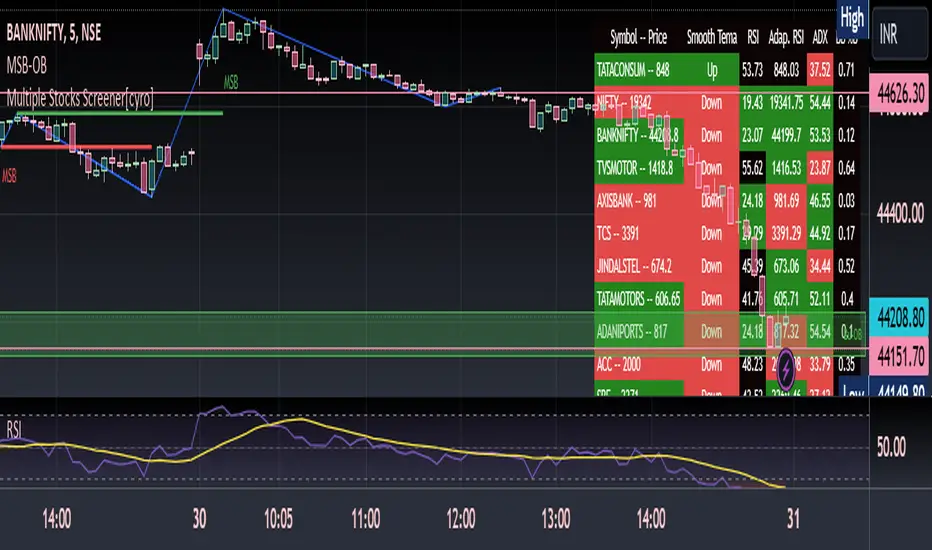
This is a stock screener that incorporates open source code by QuantNomad, with the addition of slow and fast EMA pullback and crossover functions. It is designed for intraday scalping and quick trades, using 1, 3, and 5 minute candles. The RSI, Supertrend, and ADX indicators help to confirm trade setups, and the use of discount, premium, and equilibrium zones can improve results. With the ability to screen 40 stocks, the screener ensures that no quick action is missed. ]
Disclaimer
It is important to note that any trade initiated using this screener should be well researched, as the creator is not responsible for any profit or loss incurred.
Disclaimer
It is important to note that any trade initiated using this screener should be well researched, as the creator is not responsible for any profit or loss incurred.
版本注释
Closing price of script Fixed for ema calculation.版本注释
Fiixed False AlertsAdded colour indicator on price column. Obvious Green/Red and Orange is no change. (Price is rounded of on close.
Now EmaCrossover entry is calculated with TrueRange and High/Low. (More Accurate)
版本注释
This update includes several new features that enhance the usability and customization options of the script. One of the most notable features is the ability to switch between table colors for dark mode and light mode, making it easier to use the script in different lighting conditions. Additionally, users can now customize the position of the table and adjust the font size, with the option to use a tiny font size specifically for mobile apps.The update also introduces several new indicators, including a custom adapted RSI indicator, Smooth TEMA indicator, and BB %B indicator. However, there are some limitations to the script that users should be aware of. The function for hidden and regular divergence in the RSI convergence divergence indicator may cause the script to run slowly at times due to the high number of if statements, so non-premium users may experience errors prompting them to reload the script due to limited resources allotted for non-premium users. This issue is currently under evaluation and efforts are being made to resolve it. In the meantime, if this error occurs, users can simply change charts without removing the screener and adding it again.
Another limitation to note is that the barsince function statement in the RSI convergence divergence script may cause errors if used on higher timeframes like 1 day, resulting in a "study referenced too many bars" error. While there are solutions being considered to address this issue, it is important to note that the script works well and has been tested for accuracy, with values that match those of the original indicator scripts.
Overall, this update offers a range of new customization and analysis features that make the script more versatile and powerful than ever before, while also being transparent about its limitations and ongoing efforts to address them.
版本注释
Minor adjustment in manual errors.版本注释
Emergency Update to rectify the study uses 1.7 times more computational power than allowed. Your patience is appreciated, and your feedback is valuable. Apologies and thank you!!!开源脚本
秉承TradingView的精神,该脚本的作者将其开源,以便交易者可以查看和验证其功能。向作者致敬!您可以免费使用该脚本,但请记住,重新发布代码须遵守我们的网站规则。
免责声明
这些信息和出版物并非旨在提供,也不构成TradingView提供或认可的任何形式的财务、投资、交易或其他类型的建议或推荐。请阅读使用条款了解更多信息。
开源脚本
秉承TradingView的精神,该脚本的作者将其开源,以便交易者可以查看和验证其功能。向作者致敬!您可以免费使用该脚本,但请记住,重新发布代码须遵守我们的网站规则。
免责声明
这些信息和出版物并非旨在提供,也不构成TradingView提供或认可的任何形式的财务、投资、交易或其他类型的建议或推荐。请阅读使用条款了解更多信息。