OPEN-SOURCE SCRIPT
DXY Z-Score
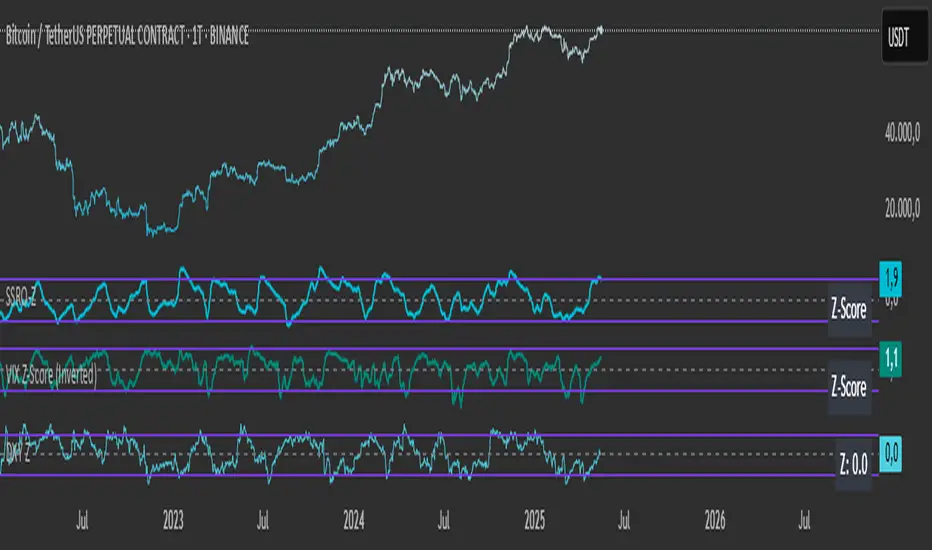
The "DXY Z-Score" indicator measures the US Dollar Index’s (DXY) current price relative to its recent average, normalized by its standard deviation.
It calculates a standardized Z-Score that oscillates around zero, highlighting when the DXY is significantly overbought or oversold.
Key features include:
- The Z-Score line oscillating between fixed upper (+2) and lower (-2) horizontal levels
- A shaded background to emphasize the Z-Score range between these bands
- A dynamic table showing the current Z-Score value linked linearly to the Z-Score plot
This indicator is useful for assessing the strength or weakness of the US Dollar relative to its recent history, providing insights into potential market reversals or trend continuations.
开源脚本
秉承TradingView的精神,该脚本的作者将其开源,以便交易者可以查看和验证其功能。向作者致敬!您可以免费使用该脚本,但请记住,重新发布代码须遵守我们的网站规则。
免责声明
这些信息和出版物并非旨在提供,也不构成TradingView提供或认可的任何形式的财务、投资、交易或其他类型的建议或推荐。请阅读使用条款了解更多信息。
开源脚本
秉承TradingView的精神,该脚本的作者将其开源,以便交易者可以查看和验证其功能。向作者致敬!您可以免费使用该脚本,但请记住,重新发布代码须遵守我们的网站规则。
免责声明
这些信息和出版物并非旨在提供,也不构成TradingView提供或认可的任何形式的财务、投资、交易或其他类型的建议或推荐。请阅读使用条款了解更多信息。