OPEN-SOURCE SCRIPT
已更新 Custom EMA from X Days Ago
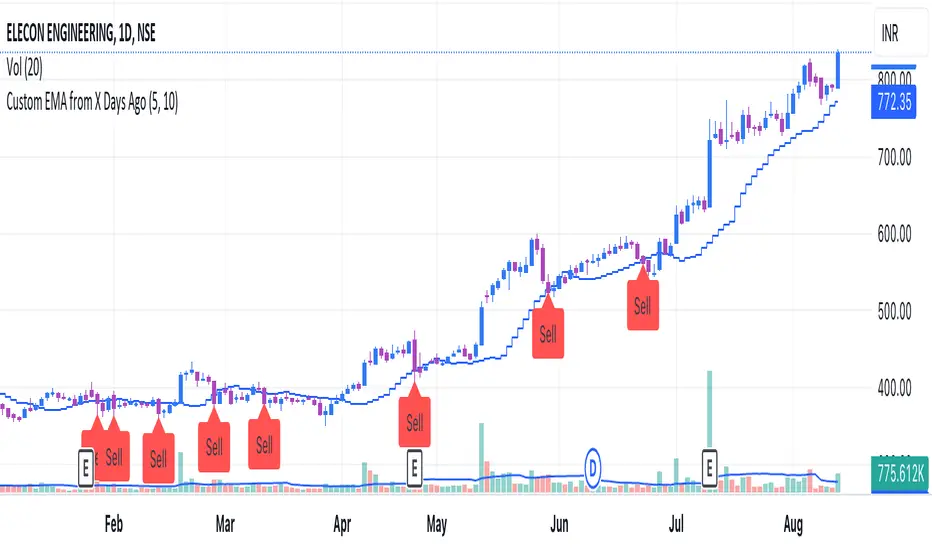
This is an indicator to plot the selected EMA value from X days ago on today's candle.
Or it will helps to plot the previous candle's EMA value on current candle.
Or it will helps to plot the previous candle's EMA value on current candle.
版本注释
Bug fixed.Updated with a 'sell' label to trail the stop.
Now it will work on all time frames.
开源脚本
秉承TradingView的精神,该脚本的作者将其开源,以便交易者可以查看和验证其功能。向作者致敬!您可以免费使用该脚本,但请记住,重新发布代码须遵守我们的网站规则。
免责声明
这些信息和出版物并非旨在提供,也不构成TradingView提供或认可的任何形式的财务、投资、交易或其他类型的建议或推荐。请阅读使用条款了解更多信息。
开源脚本
秉承TradingView的精神,该脚本的作者将其开源,以便交易者可以查看和验证其功能。向作者致敬!您可以免费使用该脚本,但请记住,重新发布代码须遵守我们的网站规则。
免责声明
这些信息和出版物并非旨在提供,也不构成TradingView提供或认可的任何形式的财务、投资、交易或其他类型的建议或推荐。请阅读使用条款了解更多信息。