OPEN-SOURCE SCRIPT
已更新 Greer Book Value Yield

📘 Script Title
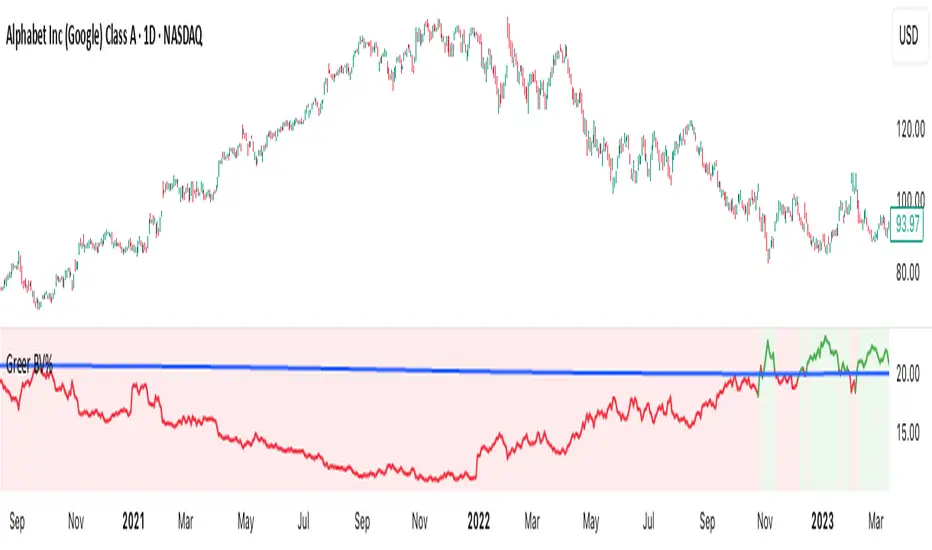
Greer Book Value Yield – Valuation Insight Based on Balance Sheet Strength
🧾 Description
Greer Book Value Yield is a valuation-focused indicator in the Greer Financial Toolkit, designed to evaluate how much net asset value (book value) a company provides per share relative to its current market price. This script calculates the Book Value Per Share Yield (BV%) using the formula:
Book Value Yield (%) = Book Value Per Share ÷ Stock Price × 100
This yield helps investors assess whether a stock is trading at a discount or premium to its underlying assets. It dynamically highlights when the yield is:
🟢 Above its historical average (potentially undervalued)
🔴 Below its historical average (potentially overvalued)
🔍 Use Case
Analyze valuation through asset-based metrics
Identify buy opportunities when book value yield is historically high
Combine with other scripts in the Greer Financial Toolkit:
📘 Greer Value – Tracks year-over-year growth consistency across six key metrics
📊 Greer Value Yields Dashboard – Visualizes multiple valuation-based yields
🟢 Greer BuyZone – Highlights long-term technical buy zones
🛠️ Inputs & Data
Uses Book Value Per Share (BVPS) from TradingView’s financial database (Fiscal Year)
Calculates and compares against a static average yield to assess historical valuation
Clean visual feedback via dynamic coloring and overlays
⚠️ Disclaimer
This tool is for educational and informational purposes only and should not be considered financial advice. Always conduct your own research before making investment decisions.
版本注释
Added Book Value Stat to the display.status_line for reference开源脚本
秉承TradingView的精神,该脚本的作者将其开源,以便交易者可以查看和验证其功能。向作者致敬!您可以免费使用该脚本,但请记住,重新发布代码须遵守我们的网站规则。
免责声明
这些信息和出版物并非旨在提供,也不构成TradingView提供或认可的任何形式的财务、投资、交易或其他类型的建议或推荐。请阅读使用条款了解更多信息。
开源脚本
秉承TradingView的精神,该脚本的作者将其开源,以便交易者可以查看和验证其功能。向作者致敬!您可以免费使用该脚本,但请记住,重新发布代码须遵守我们的网站规则。
免责声明
这些信息和出版物并非旨在提供,也不构成TradingView提供或认可的任何形式的财务、投资、交易或其他类型的建议或推荐。请阅读使用条款了解更多信息。