OPEN-SOURCE SCRIPT
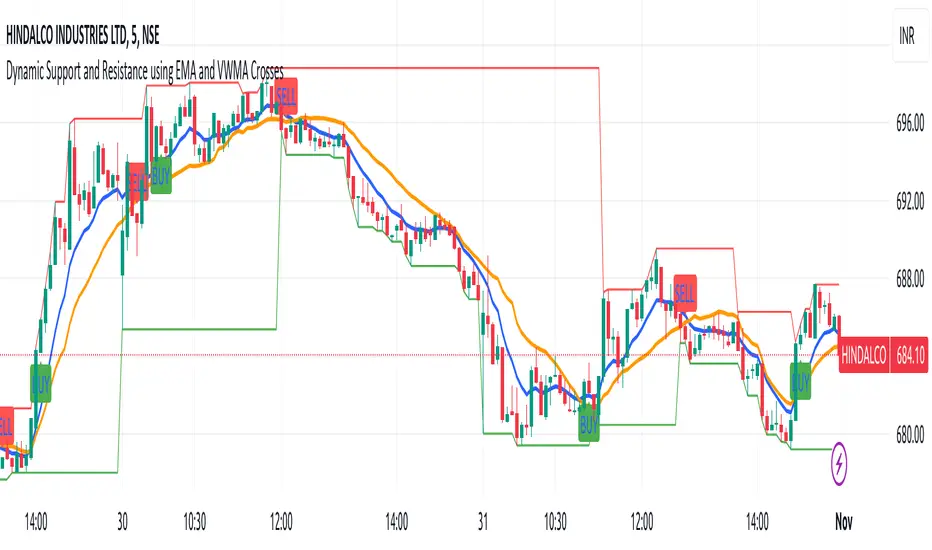
Intraday buy and sell indicator for stock and options

This powerful intraday trading indicator leverages two key crossovers for buy and sell signals, optimized for stocks and options trading:
EMA9 Crossover: The 9-period Exponential Moving Average (EMA9) responds quickly to price changes, making it ideal for capturing short-term momentum shifts. A bullish signal is generated when the stock price crosses above the EMA9, indicating a potential upward trend, while a bearish signal occurs when the price crosses below, signaling a potential reversal.
VWMA Crossover Confirmation: The Volume-Weighted Moving Average (VWMA) provides further confirmation of trend direction by integrating volume data. When the VWMA aligns with EMA9 (price crosses above both for buy or below for sell), the signals are validated, increasing the probability of a successful trade.
How It Works:
Buy Signal: Generated when the stock price crosses above EMA9 and VWMA in unison, indicating strong bullish momentum.
Sell Signal: Generated when the stock price crosses below EMA9 and VWMA, signaling potential bearish momentum.
This indicator is designed to provide high-quality entry and exit points for intraday trades, filtering out weaker signals and reducing whipsaws. It’s ideal for active traders seeking a strategic edge by combining price action with volume confirmation for higher probability trades.
开源脚本
秉承TradingView的精神,该脚本的作者将其开源,以便交易者可以查看和验证其功能。向作者致敬!您可以免费使用该脚本,但请记住,重新发布代码须遵守我们的网站规则。
免责声明
这些信息和出版物并非旨在提供,也不构成TradingView提供或认可的任何形式的财务、投资、交易或其他类型的建议或推荐。请阅读使用条款了解更多信息。
开源脚本
秉承TradingView的精神,该脚本的作者将其开源,以便交易者可以查看和验证其功能。向作者致敬!您可以免费使用该脚本,但请记住,重新发布代码须遵守我们的网站规则。
免责声明
这些信息和出版物并非旨在提供,也不构成TradingView提供或认可的任何形式的财务、投资、交易或其他类型的建议或推荐。请阅读使用条款了解更多信息。