OPEN-SOURCE SCRIPT
Dominant Smoothed Volume Pro
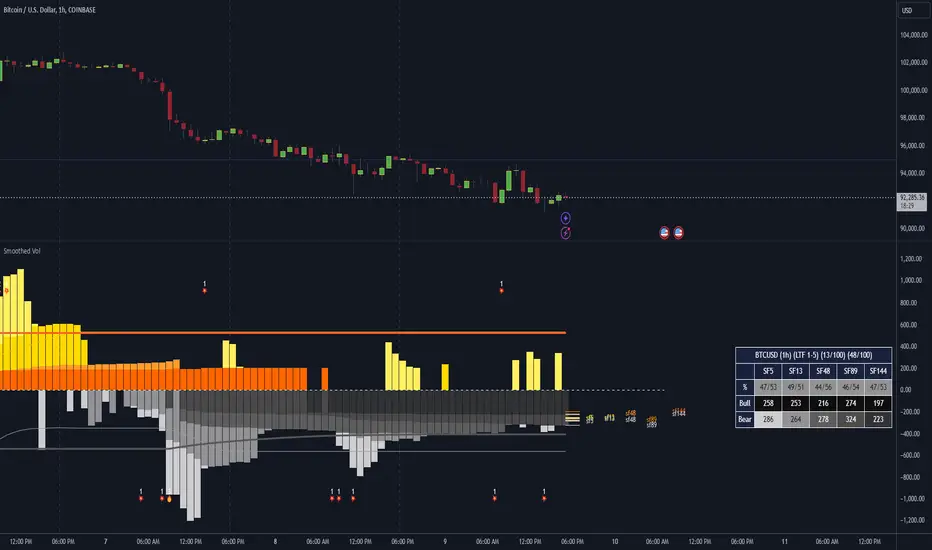
Smoothed Volume Pro provides a useful tool designed to provide traders with a deeper understanding of market dynamics by analyzing buy and sell volume across multiple timeframes. Unlike traditional volume indicators, this script normalizes volume data from lower timeframes to align with the current chart's timeframe, providing an apples-to-apples comparison. The result is a visual histogram representation of the dominant buy or sell activity, smoothed over 5 different periods to reflect momentum shifts and enhance clarity.
Core Methodology
1. Multi-Timeframe Volume Analysis
This indicator leverages data from five different lower timeframes, each chosen dynamically based on the current chart's timeframe. By aggregating and normalizing these granular data points, the indicator captures subtle shifts in buy and sell volume that might otherwise go unnoticed. This multi-timeframe approach allows for a more detailed and accurate representation of market activity.
2. Data Normalization
Normalization is a critical component of this indicator. It ensures that volume data from lower timeframes is scaled appropriately to match the total volume of the current chart's timeframe. This step eliminates discrepancies caused by varying time intervals, providing a more meaningful comparison of volume trends across different periods.
3. Smoothing for Momentum Representation
The indicator employs five customizable smoothing factors to smooth out noisy volume data.
Each smoothing factor is distinctly color-coded in the histogram and table for intuitive analysis, helping traders quickly identify prevailing trends.
Features and Benefits
➖Customizable Smoothing Factors: Choose from five different smoothing factors, each with its unique settings for line styles, colors, and extensions.
➖Normalized Buy and Sell Volume: Displays normalized buy and sell volumes as a percentage of total activity, aiding in quick decision-making.
➖Visual Cues: Color-coded columns and labels help identify dominant trends at a glance, with high-opacity fills for visual clarity.
➖Dynamic Table: A built-in table summarizes smoothed volume data for each smoothing factor, offering a quick overview of bullish and bearish percentages.
➖Momentum Signals: Detect significant shifts in volume momentum with visually distinct alerts for high relative volumes, including special symbols like "⚡" and "🔥."
Practical Applications
➖Identifying Market Sentiment: Quickly determine whether the market is dominated by buyers or sellers at any given moment.
➖Spotting Reversals: Use momentum shifts in smoothed volume to anticipate potential trend reversals.
➖Enhancing Entry and Exit Points: Combine this indicator with other technical tools to refine entry and exit points in your trading strategy.
Why This Indicator Stands Out
Many existing volume indicators focus solely on raw or single-timeframe data, which can be misleading or incomplete. This indicator sets itself apart by:
Utilizing multi-timeframe data to provide a holistic view of market activity.
Applying robust normalization techniques to ensure data consistency.
Offering advanced smoothing options to emphasize actionable momentum signals.
This unique combination of features makes it an indispensable tool for traders seeking to enhance their market analysis and decision-making process.
As always, by combining the Smoothed Volume Pro with other tools, traders ensure that they are not relying on a single indicator. This layered approach can reduce the likelihood of false signals and improve overall trading accuracy.
Here's an additional visual representation using the plot fills:
https://www.tradingview.com/x/QmT3qAT9/
开源脚本
秉承TradingView的精神,该脚本的作者将其开源,以便交易者可以查看和验证其功能。向作者致敬!您可以免费使用该脚本,但请记住,重新发布代码须遵守我们的网站规则。
🆓 Free scripts:
⚡ Pro scripts: tradingview.com/script/hESCvPuH-Predictive-Volume-MTF-Pro/
🙋♂️ Get help with Pinescript: simplecrypto.life/get-help-with-pinescript
⚡ Pro scripts: tradingview.com/script/hESCvPuH-Predictive-Volume-MTF-Pro/
🙋♂️ Get help with Pinescript: simplecrypto.life/get-help-with-pinescript
免责声明
这些信息和出版物并非旨在提供,也不构成TradingView提供或认可的任何形式的财务、投资、交易或其他类型的建议或推荐。请阅读使用条款了解更多信息。