OPEN-SOURCE SCRIPT
已更新 Index Options Expirations and Calendar Effects

Features
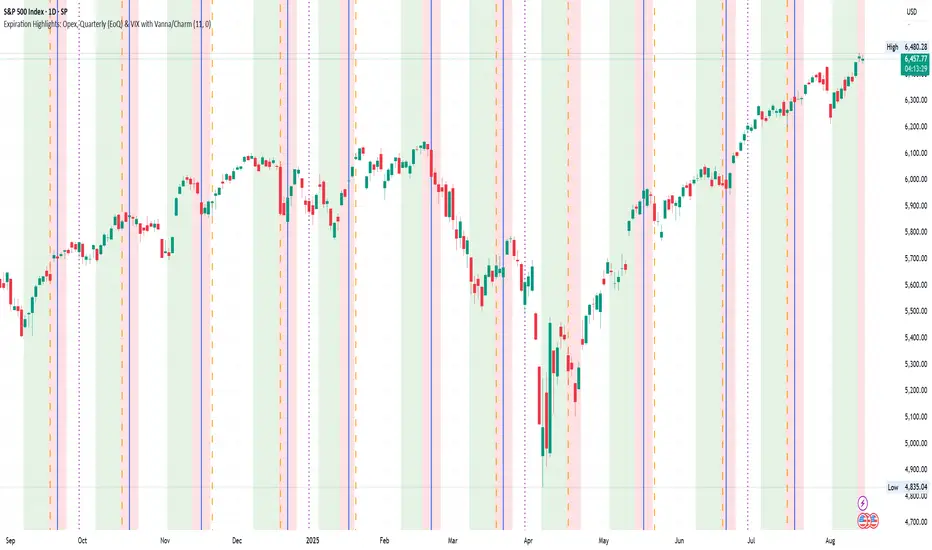
- Highlights monthly equity options expiration (opex) dates.
- Marks VIX options expiration dates based on standard 30-day offset.
- Shows configurable vanna/charm pre-expiration window (green shading).
- Shows configurable post-opex weakness window (red shading).
- Adjustable colors, start/end offsets, and on/off toggles for each element.
What this does
This overlay highlights option-driven calendar windows around monthly equity options expiration (opex) and VIX options expiration. It draws:
- Solid blue lines on the third Friday of each month (typical monthly opex).
- Dashed orange lines on the Wednesday ~30 days before next month’s opex (typical VIX expiration schedule).
- Green shading during a pre-expiration window when vanna/charm effects are often strongest.
- Red shading during the post-expiration "window of non-strength" often observed into the Tuesday after opex.
How it works
1. Monthly opex is detected when Friday falls between the 15th–21st of the month.
2. VIX expiration is calculated by finding next month’s opex date, then subtracting 30 calendar days and marking that Wednesday.
3. Vanna/charm window (green): starts on the Monday of the week before opex and ends on Tuesday of opex week.
4. Post-opex weakness window (red): starts Wednesday of opex week and ends Tuesday after opex.
How to use
- Add to any chart/timeframe.
- Adjust inputs to toggle VIX/opex lines, choose colors, and fine-tune the start/end offsets for shaded windows.
- This is an educational visualization of typical timing and not a trading signal.
Limitations
- Exchange holidays and contract-specific exceptions can shift expirations; this script uses standard calendar rules.
- No forward-looking data is used; all dates are derived from historical and current bar time.
- Past patterns do not guarantee future behavior.
Originality
Provides a single, adjustable visualization combining opex, VIX expiration, and configurable vanna/charm/weakness windows into one tool. Fully explained so non-coders can use it without reading the source code.
版本注释
Features - Highlights monthly equity options expiration (opex) dates.
- Marks VIX options expiration dates based on standard 30-day offset.
- Shows configurable vanna/charm pre-expiration window (green shading).
- Shows configurable post-opex weakness window (red shading).
- Adjustable colors, start/end offsets, and on/off toggles for each element.
What this does
This overlay highlights option-driven calendar windows around monthly equity options expiration (opex) and VIX options expiration. It draws:
- Solid blue lines on the third Friday of each month (typical monthly opex).
- Dashed orange lines on the Wednesday ~30 days before next month’s opex (typical VIX expiration schedule).
- Green shading during a pre-expiration window when vanna/charm effects are often strongest.
- Red shading during the post-expiration "window of non-strength" often observed into the Tuesday after opex.
How it works
1. Monthly opex is detected when Friday falls between the 15th–21st of the month.
2. VIX expiration is calculated by finding next month’s opex date, then subtracting 30 calendar days and marking that Wednesday.
3. Vanna/charm window (green): starts on the Monday of the week before opex and ends on Tuesday of opex week.
4. Post-opex weakness window (red): starts Wednesday of opex week and ends Tuesday after opex.
How to use
- Add to any chart/timeframe.
- Adjust inputs to toggle VIX/opex lines, choose colors, and fine-tune the start/end offsets for shaded windows.
- This is an educational visualization of typical timing and not a trading signal.
Limitations
- Exchange holidays and contract-specific exceptions can shift expirations; this script uses standard calendar rules.
- No forward-looking data is used; all dates are derived from historical and current bar time.
- Past patterns do not guarantee future behavior.
Originality
Provides a single, adjustable visualization combining opex, VIX expiration, and configurable vanna/charm/weakness windows into one tool. Fully explained so non-coders can use it without reading the source code.
开源脚本
秉承TradingView的精神,该脚本的作者将其开源,以便交易者可以查看和验证其功能。向作者致敬!您可以免费使用该脚本,但请记住,重新发布代码须遵守我们的网站规则。
免责声明
这些信息和出版物并非旨在提供,也不构成TradingView提供或认可的任何形式的财务、投资、交易或其他类型的建议或推荐。请阅读使用条款了解更多信息。
开源脚本
秉承TradingView的精神,该脚本的作者将其开源,以便交易者可以查看和验证其功能。向作者致敬!您可以免费使用该脚本,但请记住,重新发布代码须遵守我们的网站规则。
免责声明
这些信息和出版物并非旨在提供,也不构成TradingView提供或认可的任何形式的财务、投资、交易或其他类型的建议或推荐。请阅读使用条款了解更多信息。