OPEN-SOURCE SCRIPT
USDTUSD Stochastic RSI [SAKANE]
Release Note
■ Overview
The USDTUSD Stochastic RSI [SAKANE] indicator visualizes shifts in market sentiment and liquidity by applying the Stochastic RSI to the USDT/USD price pair.
Rather than tracking the price of Bitcoin directly, this tool observes the momentum of USDT, a key intermediary in most crypto transactions, to detect early signals of trend reversals.
■ Background & Motivation
USDT exhibits two distinct characteristics:
Its credibility as a long-term store of value is limited.
Yet, it serves as one of the most liquid assets in the crypto space and is widely used as a trading base pair.
Because most BTC trades involve converting fiat into USDT and vice versa, USDT/USD frequently deviates slightly from its peg to USD.
These deviations—though subtle—often occur just before major shifts in the broader crypto market.
This indicator is designed to detect such moments of structural imbalance by applying momentum analysis to USDT itself.
■ Feature Highlights
Calculates RSI and Stochastic RSI on the USDT/USD closing price
Supports customizable smoothing via SMA or EMA
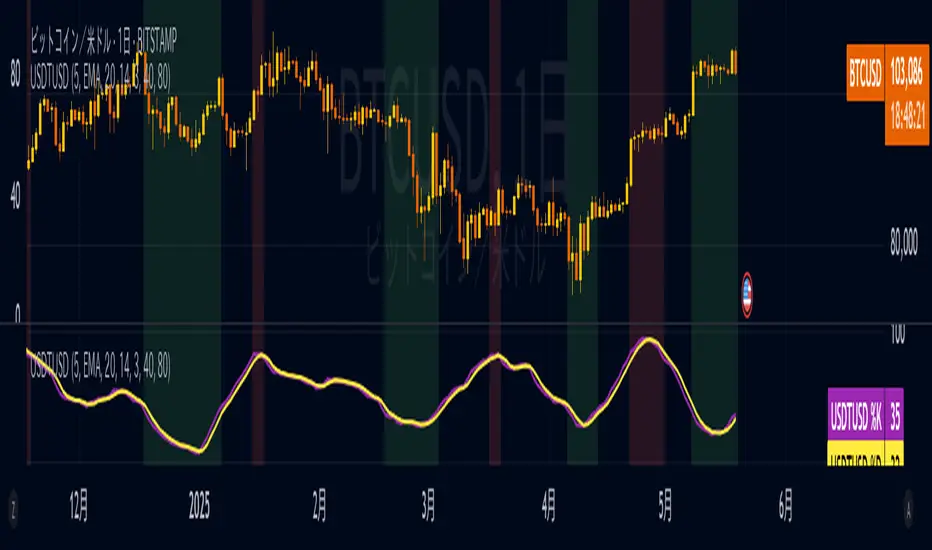
Background shading dynamically visualizes overheated or cooled market states (thresholds are adjustable)
Displayed in a separate pane, keeping it visually distinct from the price chart
■ Usage Insights
This indicator is based on an observable pattern:
When the Stochastic RSI bottoms out, Bitcoin tends to form a price bottom shortly afterward
Conversely, when the indicator peaks, Bitcoin tends to top out with a slight delay
Since USDT acts as a gateway for capital in and out of the market, changes in its momentum often foreshadow turning points in BTC.
This allows traders to anticipate shifts in sentiment rather than merely reacting to them.
■ Unique Value Proposition
Unlike conventional price-based indicators, this tool offers a structural perspective.
It focuses on USDT as a mechanism of liquidity flow, making it possible to detect the "hidden rhythm" of the crypto market.
In that sense, this is not just a technical tool, but an entry point into market microstructure analysis—allowing users to read the market’s intentions rather than just its movements.
■ Practical Tips
Look for reversals in momentum as potential BTC entry or exit points.
Overlay this indicator with the BTC chart to compare timing and divergence.
Combine with other tools such as on-chain data or macro indicators for comprehensive analysis.
■ Final Thoughts
USDTUSD Stochastic RSI [SAKANE] is designed with the belief that the most important market signals often come from what drives the price, not the price itself.
By tuning into the “heartbeat” of capital flow, this indicator sheds light on market dynamics that would otherwise remain unseen.
We hope it proves useful in your trading and research.
■ Overview
The USDTUSD Stochastic RSI [SAKANE] indicator visualizes shifts in market sentiment and liquidity by applying the Stochastic RSI to the USDT/USD price pair.
Rather than tracking the price of Bitcoin directly, this tool observes the momentum of USDT, a key intermediary in most crypto transactions, to detect early signals of trend reversals.
■ Background & Motivation
USDT exhibits two distinct characteristics:
Its credibility as a long-term store of value is limited.
Yet, it serves as one of the most liquid assets in the crypto space and is widely used as a trading base pair.
Because most BTC trades involve converting fiat into USDT and vice versa, USDT/USD frequently deviates slightly from its peg to USD.
These deviations—though subtle—often occur just before major shifts in the broader crypto market.
This indicator is designed to detect such moments of structural imbalance by applying momentum analysis to USDT itself.
■ Feature Highlights
Calculates RSI and Stochastic RSI on the USDT/USD closing price
Supports customizable smoothing via SMA or EMA
Background shading dynamically visualizes overheated or cooled market states (thresholds are adjustable)
Displayed in a separate pane, keeping it visually distinct from the price chart
■ Usage Insights
This indicator is based on an observable pattern:
When the Stochastic RSI bottoms out, Bitcoin tends to form a price bottom shortly afterward
Conversely, when the indicator peaks, Bitcoin tends to top out with a slight delay
Since USDT acts as a gateway for capital in and out of the market, changes in its momentum often foreshadow turning points in BTC.
This allows traders to anticipate shifts in sentiment rather than merely reacting to them.
■ Unique Value Proposition
Unlike conventional price-based indicators, this tool offers a structural perspective.
It focuses on USDT as a mechanism of liquidity flow, making it possible to detect the "hidden rhythm" of the crypto market.
In that sense, this is not just a technical tool, but an entry point into market microstructure analysis—allowing users to read the market’s intentions rather than just its movements.
■ Practical Tips
Look for reversals in momentum as potential BTC entry or exit points.
Overlay this indicator with the BTC chart to compare timing and divergence.
Combine with other tools such as on-chain data or macro indicators for comprehensive analysis.
■ Final Thoughts
USDTUSD Stochastic RSI [SAKANE] is designed with the belief that the most important market signals often come from what drives the price, not the price itself.
By tuning into the “heartbeat” of capital flow, this indicator sheds light on market dynamics that would otherwise remain unseen.
We hope it proves useful in your trading and research.
开源脚本
秉承TradingView的精神,该脚本的作者将其开源,以便交易者可以查看和验证其功能。向作者致敬!您可以免费使用该脚本,但请记住,重新发布代码须遵守我们的网站规则。
免责声明
这些信息和出版物并非旨在提供,也不构成TradingView提供或认可的任何形式的财务、投资、交易或其他类型的建议或推荐。请阅读使用条款了解更多信息。
开源脚本
秉承TradingView的精神,该脚本的作者将其开源,以便交易者可以查看和验证其功能。向作者致敬!您可以免费使用该脚本,但请记住,重新发布代码须遵守我们的网站规则。
免责声明
这些信息和出版物并非旨在提供,也不构成TradingView提供或认可的任何形式的财务、投资、交易或其他类型的建议或推荐。请阅读使用条款了解更多信息。