OPEN-SOURCE SCRIPT
已更新 William %R MTF [DM]
Greeting Colleagues
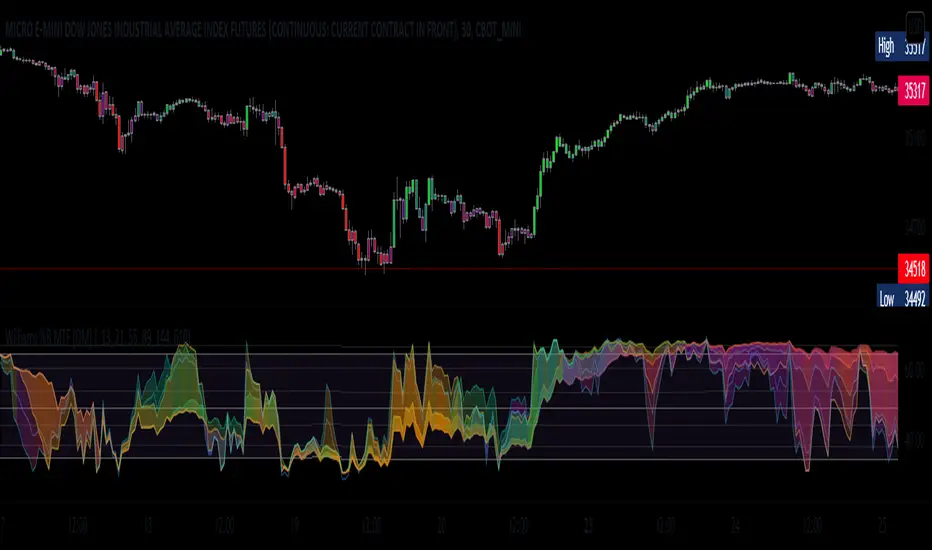
Today I share The Wlliams %R
Extras=
- 5 diferent length
- 1 extra signal with the technique used in the ultimate oscillator
- Fibo Leves based on ob os leves "width it's automatic"
- Colored bars bassed en average strength
- The indicator that is modified now has the same range as the ultimate oscillator.
Enjoy [;-)
//The Williams %R (%R) indicator was created by famed commodities trader and author Larry Williams.
//
//Calculation
//%R = (CurrentClose - Highest High) / (Highest High - Lowest Low) x -100
//
//Highest High = Highest High for the user defined look-back period.
//Lowest Low = Lowest Low for the user defined look-back period.
//
//The basics
//As previously mentioned, the %R is used to measure momentum. %R oscillates
//within a fixed range between the values of 0 and -100. Williams himself set the
//parameters of overbought as any reading between 0 and -20. His oversold
//parameters were readings between -80 and -100. It is important to note that these
//values are traditional examples. It may be beneficial for the technical analyst
//to set different parameters based on the specific instrument being analyzed. Wider
//or narrower overbought and oversold levels may be appropriate based on historical analysis.
//
//What to look for
//There are two major conditions identified by using the %R indicator.
//The first is standard overbought and oversold conditions. The second is momentum
//changes characterized by momentum failures.
//
//Overbought/Oversold
//Overbought and Oversold conditions are a very common signal generated by momentum oscillators.
//The %R indicator is no different.
版本注释
Minor changes版本注释
Added butterfly color rules to plotsAdded switch to hide parcels
版本注释
Minor changes版本注释
Added black background for use in the white charts开源脚本
秉承TradingView的精神,该脚本的作者将其开源,以便交易者可以查看和验证其功能。向作者致敬!您可以免费使用该脚本,但请记住,重新发布代码须遵守我们的网站规则。
免责声明
这些信息和出版物并非旨在提供,也不构成TradingView提供或认可的任何形式的财务、投资、交易或其他类型的建议或推荐。请阅读使用条款了解更多信息。
免责声明
这些信息和出版物并非旨在提供,也不构成TradingView提供或认可的任何形式的财务、投资、交易或其他类型的建议或推荐。请阅读使用条款了解更多信息。