PROTECTED SOURCE SCRIPT
已更新 EMA Cross RSI Filter [EPS]
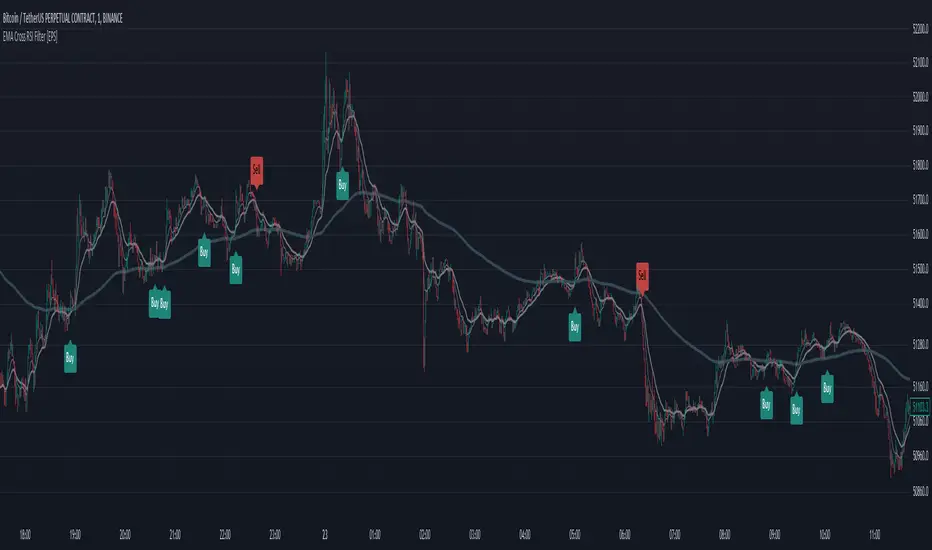
The "EMA Cross RSI Filter [EPS]" is a technical analysis tool that combines the power of Exponential Moving Averages (EMAs) with the Relative Strength Index (RSI) to provide clear buy and sell signals on financial charts. Utilizing the dynamic interaction between a fast and a medium EMA, it identifies potential trend reversals. This is further refined by the RSI which filters signals based on momentum, with a custom threshold to pinpoint optimal entry and exit points.
🔹 KEY FEATURES
Dynamic EMA Crossover: Detects potential market turns with a fast EMA crossing a medium EMA.
Momentum-Filtered RSI: Enhances signal reliability by incorporating momentum data from the RSI.
Trend-Following Confirmation: Ensures trades are in harmony with the broader market direction by considering the long-term EMA.
Adaptable Parameters: Empowers traders to tailor EMA periods and RSI thresholds to their unique trading blueprint.
🔹 TRADING APPLICATION
Buy Indications: Presented when the fast EMA ascends above the medium EMA while the asset's price surpasses the long-term EMA, and the RSI exceeds the established long level.
Sell Projections: Emerge when the fast EMA descends below the medium EMA, combined with the asset's price dropping beneath the long-term EMA and the RSI falling short of the prescribed short level.
Custom Visibility: Offers the flexibility to display or conceal EMA lines for a streamlined chart analysis experience.
🔹 STRATEGIC INTEGRATION
This analytical tool is optimized for traders who prioritize a disciplined methodology in market entry and exit, bolstered by the validation of trend direction and momentum agreement.
Capital Management Synergy: You can seamlessly integrate these signals with your personal risk management strategy, enhancing the effectiveness of your trades.
Stop-Loss and Take-Profit: It's advisable to set stop-loss orders at the previous swing low for buys, or swing high for sells. For take-profit levels, a Risk to Reward ratio of 1 to 1.5 or a preferred measure can be employed to systematically secure gains.
🔶 APPROACH
This tool caters to both trend-following and breakout strategies. It's designed for traders who want a systematic approach to enter and exit the market with the added confidence of trend and momentum confirmation.
🔹 NOTE
Indicator does not repaint.
Optimal for various timeframes and trading instruments.
Best used in trending markets for higher reliability.
🔶 SETUP
EMA Lengths: Fast (9), Medium (21), Long (200).
RSI Settings: Length (14), Long Threshold (50), Short Threshold (35).
Display Options: Show or hide EMA lines.
By adhering to the principle that no single indicator should dictate a trade, this tool is best used in conjunction with other analyses to confirm signals.
版本注释
Adding a source selection option for EMAs.受保护脚本
此脚本以闭源形式发布。 但是,您可以自由使用,没有任何限制 — 了解更多信息这里。
免责声明
这些信息和出版物并非旨在提供,也不构成TradingView提供或认可的任何形式的财务、投资、交易或其他类型的建议或推荐。请阅读使用条款了解更多信息。
免责声明
这些信息和出版物并非旨在提供,也不构成TradingView提供或认可的任何形式的财务、投资、交易或其他类型的建议或推荐。请阅读使用条款了解更多信息。