OPEN-SOURCE SCRIPT
Trend Chameleon
The Trend Chameleon, originally developed by Alex Cole for the Bloomberg Terminal, is a powerful tool designed to simplify trend identification and illuminate potential trading opportunities. It leverages a clear visual display to decode market movements, making it useful for traders of all experience levels.
🟠 Overview
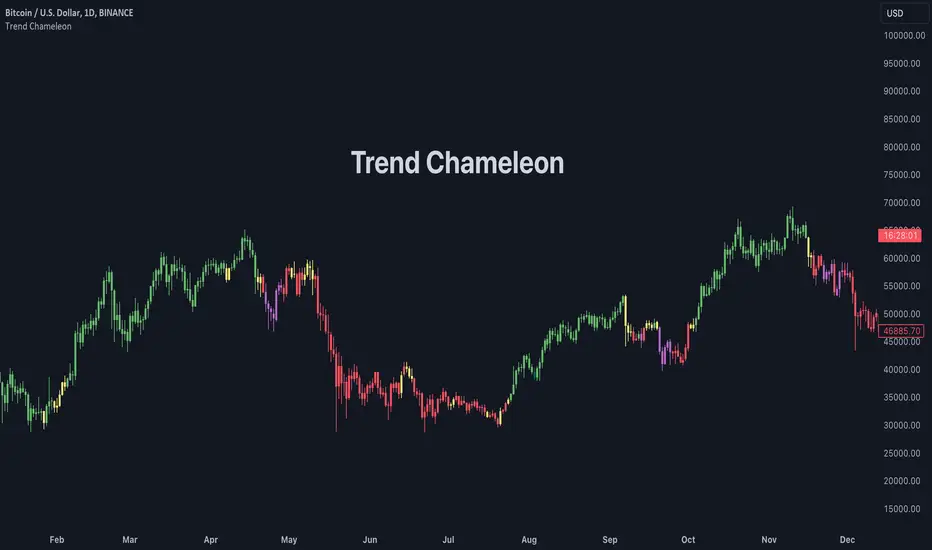
Here's an illustration of how the indicator performs for ES (S&P 500 E-mini Future) on the daily chart:

Trend Chameleon employs a color-coded candle scheme, with each color corresponding to a specific level of trend strength. Purple candles represent the strongest bearish trends, while teal candles signal the most potent bullish momentum. Between these extremes lie red, yellow, and green candles, providing a spectrum of trend direction. This intuitive color coding allows you to quickly grasp the prevailing market sentiment and identify potential entry and exit points for your trades.
🟠 Algorithm
Under the hood, Trend Chameleon evaluates four conditions to provide a directional strength score:
1. Whether the MACD value is positive.
2. Whether the SMA 50 of open prices is above the SMA 50 of the close prices.
3. Whether the ROC indicator value is positive.
4. Whether the current close price is above the SMA 50.
The total number of fulfilled conditions (0 to 4) determines the trend strength, with 0 indicating the most bearish and 4 signifying the strongest bullish trend. This score is then visually represented by coloring the bars on the chart.
🟠 Note
If you don't see the bars being properly colored after adding this indicator, please ensure Trend Chameleon is positioned on top of all other indicators in your chart. This can be easily achieved by hovering over the indicator's name, clicking the three dots, selecting "Visual Order," and then choosing "Bring to front."
🟠 Overview
Here's an illustration of how the indicator performs for ES (S&P 500 E-mini Future) on the daily chart:
Trend Chameleon employs a color-coded candle scheme, with each color corresponding to a specific level of trend strength. Purple candles represent the strongest bearish trends, while teal candles signal the most potent bullish momentum. Between these extremes lie red, yellow, and green candles, providing a spectrum of trend direction. This intuitive color coding allows you to quickly grasp the prevailing market sentiment and identify potential entry and exit points for your trades.
🟠 Algorithm
Under the hood, Trend Chameleon evaluates four conditions to provide a directional strength score:
1. Whether the MACD value is positive.
2. Whether the SMA 50 of open prices is above the SMA 50 of the close prices.
3. Whether the ROC indicator value is positive.
4. Whether the current close price is above the SMA 50.
The total number of fulfilled conditions (0 to 4) determines the trend strength, with 0 indicating the most bearish and 4 signifying the strongest bullish trend. This score is then visually represented by coloring the bars on the chart.
🟠 Note
If you don't see the bars being properly colored after adding this indicator, please ensure Trend Chameleon is positioned on top of all other indicators in your chart. This can be easily achieved by hovering over the indicator's name, clicking the three dots, selecting "Visual Order," and then choosing "Bring to front."
开源脚本
秉承TradingView的精神,该脚本的作者将其开源,以便交易者可以查看和验证其功能。向作者致敬!您可以免费使用该脚本,但请记住,重新发布代码须遵守我们的网站规则。
专业缠论指标: alphaviz.pro/chanlun
Email: contact@alphaviz.pro
Discord: discord.gg/w2fFtNega4
Email: contact@alphaviz.pro
Discord: discord.gg/w2fFtNega4
免责声明
这些信息和出版物并非旨在提供,也不构成TradingView提供或认可的任何形式的财务、投资、交易或其他类型的建议或推荐。请阅读使用条款了解更多信息。