PROTECTED SOURCE SCRIPT
GFM Analyst 01 - Price Action & EMAs
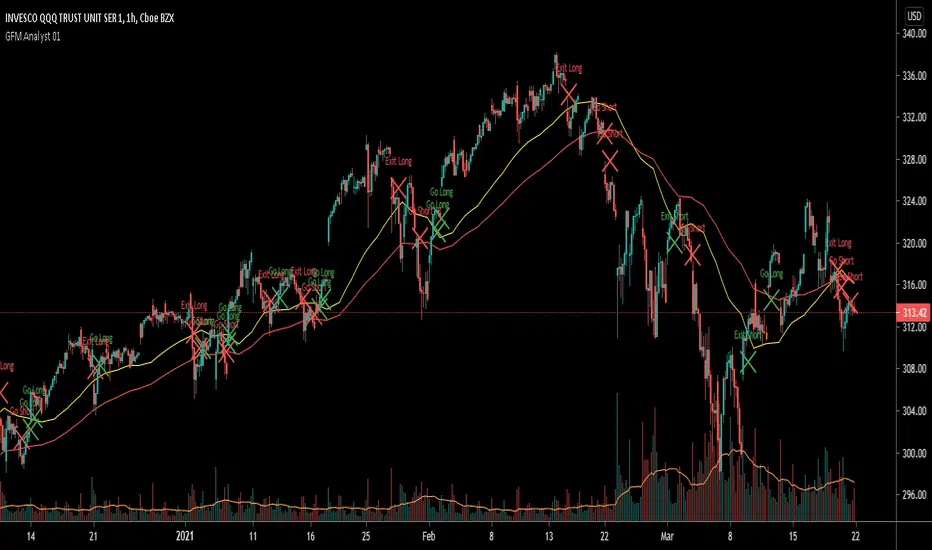
This indicator will help in identifying trends. It is using the historic price action to determine the Buy and Sell signals.
Also we have used the Exponential Moving Averages on a daily timeframe (resolution/period). This will help is eradicate any false signals.
Yellow Line = Fast Exponential Moving Average
Red Line = Slow Exponential Moving Average
On a shorter timeframe, one should ignore short signals, if the price is moving above these two EMA's and similarly ignore long signals, if the price is moving below these two EMA's.
受保护脚本
此脚本以闭源形式发布。 但是,您可以自由使用,没有任何限制 — 了解更多信息这里。
免责声明
这些信息和出版物并非旨在提供,也不构成TradingView提供或认可的任何形式的财务、投资、交易或其他类型的建议或推荐。请阅读使用条款了解更多信息。
受保护脚本
此脚本以闭源形式发布。 但是,您可以自由使用,没有任何限制 — 了解更多信息这里。
免责声明
这些信息和出版物并非旨在提供,也不构成TradingView提供或认可的任何形式的财务、投资、交易或其他类型的建议或推荐。请阅读使用条款了解更多信息。