PROTECTED SOURCE SCRIPT
已更新 Multi Time Frame RSI [Horizonn Wealth]
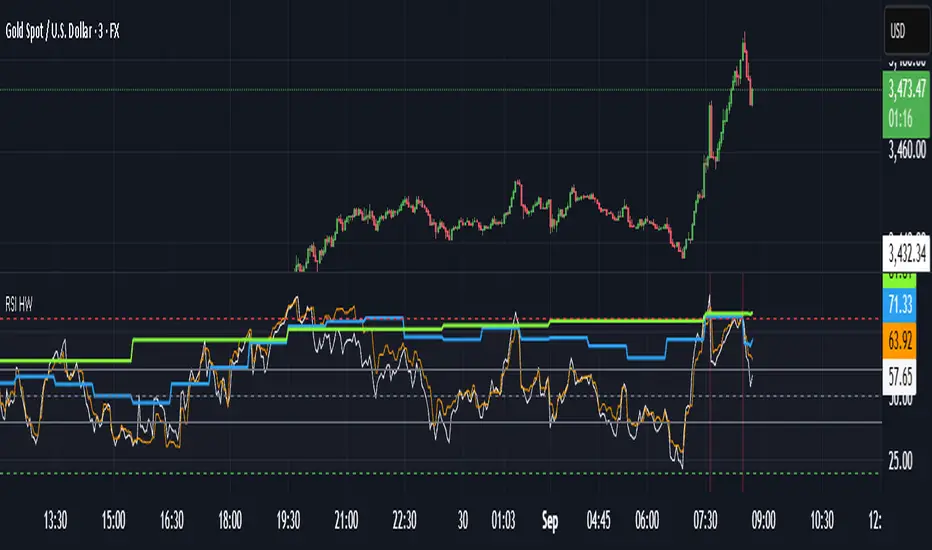
Multi-Time Frame Analysis: A key feature is the ability to choose a time frame for each of the four RSI lines from a predefined list (Chart, 1 day, 1 week, 1 month). The script uses the request.security() function with lookahead enabled to ensure the most accurate, real-time data is used for each calculation, eliminating look-ahead bias and calculation errors.
Visual Levels: The indicator plots standard RSI levels at 30, 50, and 70, with a shaded background between the oversold (30) and overbought (70) zones to provide a clear visual reference.
Momentum Alignment Signals: The script includes an optional feature that highlights the chart's background with a red or green color when all four RSIs simultaneously enter an overbought or oversold state. This serves as an immediate visual alert for a strong, multi-time frame momentum condition.
This indicator is a robust tool for technical analysis, suitable for traders who use a top-down approach to their market analysis.
版本注释
Multi-Time Frame Analysis: A key feature is the ability to choose a time frame for each of the four RSI lines from a predefined list (Chart, 1 day, 1 week, 1 month). The script uses the request.security() function with lookahead enabled to ensure the most accurate, real-time data is used for each calculation, eliminating look-ahead bias and calculation errors.Visual Levels: The indicator plots standard RSI levels at 30, 50, and 70, with a shaded background between the oversold (30) and overbought (70) zones to provide a clear visual reference.
Momentum Alignment Signals: The script includes an optional feature that highlights the chart's background with a red or green color when all four RSIs simultaneously enter an overbought or oversold state. This serves as an immediate visual alert for a strong, multi-time frame momentum condition.
This indicator is a robust tool for technical analysis, suitable for traders who use a top-down approach to their market analysis.
受保护脚本
此脚本以闭源形式发布。 但是,您可以自由使用,没有任何限制 — 了解更多信息这里。
免责声明
这些信息和出版物并非旨在提供,也不构成TradingView提供或认可的任何形式的财务、投资、交易或其他类型的建议或推荐。请阅读使用条款了解更多信息。
受保护脚本
此脚本以闭源形式发布。 但是,您可以自由使用,没有任何限制 — 了解更多信息这里。
免责声明
这些信息和出版物并非旨在提供,也不构成TradingView提供或认可的任何形式的财务、投资、交易或其他类型的建议或推荐。请阅读使用条款了解更多信息。