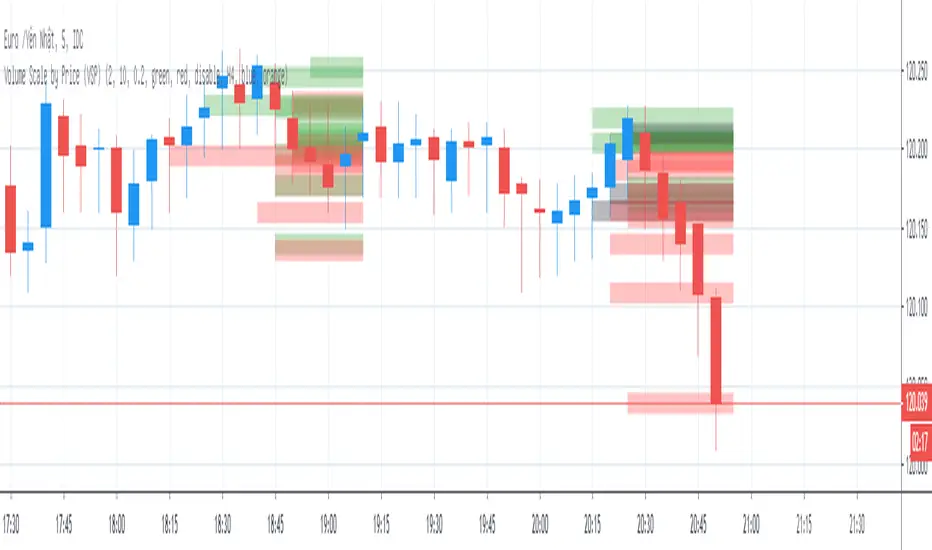
Volume Scale by Price (VSP) show volume of bar in y-axis (price-axis) with options below:
1. Number of histogram
* Number of histogram = 0 => do not plot volume histogram
* Number of histogram = 1 => plot volume of 21 lasted bar (bar [0] to bar [20])
* Number of histogram = 2 => plot volume of 21 bar next histogram 1 (bar [20] to bar [40])
2. Line width
* Columns width of histogram
3. Volume scale ratio
* Scaling histogram with justifiable ratio depend on time frame and symbol
4. Histogram color
* Color of histogram
版本注释
* Base on idea of sam_m400 about Multi Time Frame mode, the script has updated with following details:1. Adding Muti Time Frame Mode: M5, M15, M30, H1, H4
2. Update Notes:
* Due to limited of drawing data, to enable MTF Mode, pls adjust No. histograms <= 1.
* Due to limited of function "security", the MTF Mode show only volume of lasted 18 bars.
3. Thank sam_m400 for your idea.
版本注释
Add Buy & Sell color to Histogram.开源脚本
秉承TradingView的精神,该脚本的作者将其开源,以便交易者可以查看和验证其功能。向作者致敬!您可以免费使用该脚本,但请记住,重新发布代码须遵守我们的网站规则。
免责声明
这些信息和出版物并非旨在提供,也不构成TradingView提供或认可的任何形式的财务、投资、交易或其他类型的建议或推荐。请阅读使用条款了解更多信息。
免责声明
这些信息和出版物并非旨在提供,也不构成TradingView提供或认可的任何形式的财务、投资、交易或其他类型的建议或推荐。请阅读使用条款了解更多信息。