OPEN-SOURCE SCRIPT
VXN Williams %R
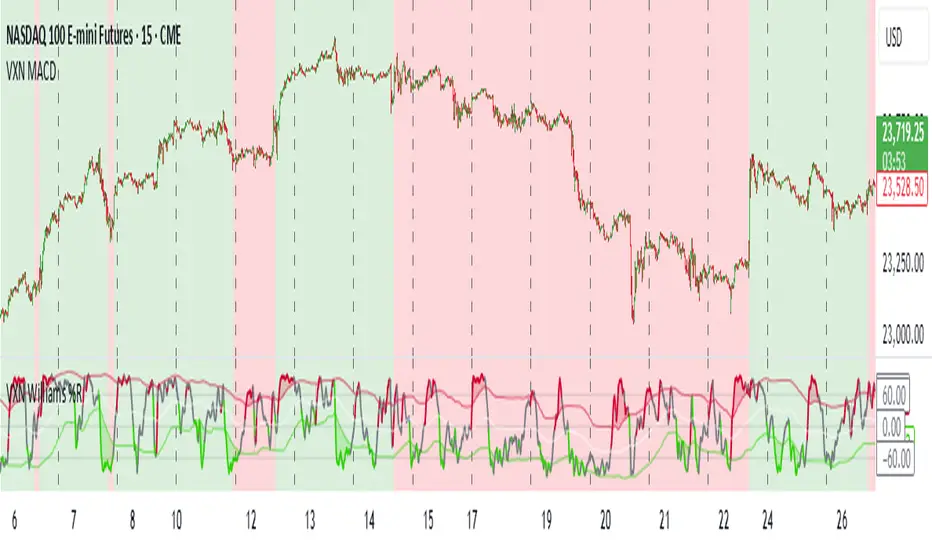
This indicator is based on other open source scripts. It's designed for trading NASDAQ futures using the Williams %R oscillator combined with Bollinger Bands.
The Williams %R is calculated based on a user-defined source and period, then smoothed with a moving average (SMA, EMA, WMA, or RMA).
Bollinger Bands are applied to the scaled Williams %R to identify overbought and oversold conditions.
The background color reflects the trend of the VXN (CBOE NASDAQ Volatility Index):
- Green background: Indicates a bullish trend (VXN EMA < VXN SMA), suggesting long entries at green peaks (Williams %R crossing above the upper Bollinger Band).
- Red background: Indicates a bearish trend (VXN EMA > VXN SMA), suggesting short entries at red peaks (Williams %R crossing below the lower Bollinger Band).
开源脚本
本着TradingView的真正精神,此脚本的创建者将其开源,以便交易者可以查看和验证其功能。向作者致敬!虽然您可以免费使用它,但请记住,重新发布代码必须遵守我们的网站规则。
免责声明
这些信息和出版物并不意味着也不构成TradingView提供或认可的金融、投资、交易或其它类型的建议或背书。请在使用条款阅读更多信息。
免责声明
这些信息和出版物并不意味着也不构成TradingView提供或认可的金融、投资、交易或其它类型的建议或背书。请在使用条款阅读更多信息。