OPEN-SOURCE SCRIPT
已更新 Trend Lines
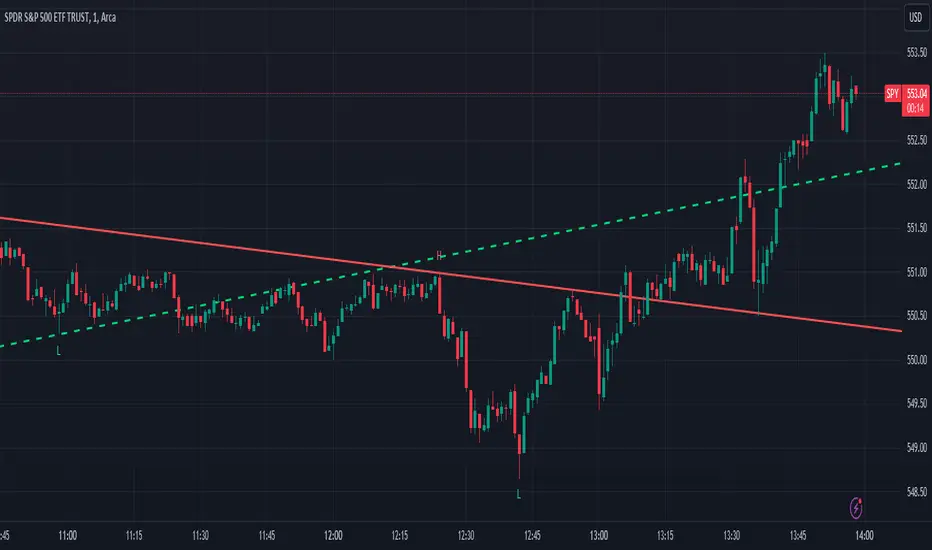
This script, titled "Trend Lines," is designed to detect and plot significant trend lines on a TradingView chart, based on pivot points. It highlights both uptrend and downtrend lines using different colors and allows customization of line styles, including color and thickness. Here's a breakdown of how the script works:
Inputs
Left Bars (lb) and Right Bars (rb): These inputs determine the number of bars to the left and right of a pivot point used to identify significant highs and lows.
Show Pivot Points: A boolean input to display markers at detected pivot points on the chart.
Show Old Line as Dashed: A boolean input to display older trend lines as dashed for visual distinction.
Uptrend Line Color (ucolor) and Downtrend Line Color (dcolor): Color inputs to customize the appearance of uptrend and downtrend lines.
Uptrend Line Thickness (uthickness) and Downtrend Line Thickness (dthickness): Inputs to adjust the thickness of the trend lines.
Calculations
Pivot Highs and Lows: The script calculates potential pivot highs and lows by looking at lb bars to the left and rb bars to the right. If a bar's high is the highest (or low is the lowest) within this window, it is considered a pivot point.
Trend Lines: The script connects the most recent and previous pivot highs to form downtrend lines, and the most recent and previous pivot lows to form uptrend lines. These lines are drawn with the specified color and thickness.
Angles: The angle of each trend line is calculated to determine whether the trend is strengthening or weakening. If the trend changes significantly, the line's extension is adjusted accordingly.
Plotting
Pivot Point Markers: If Show Pivot Points is enabled, markers labeled "H" for highs and "L" for lows are plotted at the pivot points.
Trend Lines: The script draws lines between pivot points, coloring them according to the trend direction (uptrend or downtrend). If Show Old Line as Dashed is enabled, the script sets older lines to a dashed style to indicate they are no longer the most recent trend lines.
This script is useful for traders who want to visually identify key support and resistance levels based on historical price action, helping them to make more informed trading decisions. The customization options allow traders to tailor the appearance of the trend lines to suit their personal preferences or charting style.
版本注释
Edited title and snapshot.开源脚本
秉承TradingView的精神,该脚本的作者将其开源,以便交易者可以查看和验证其功能。向作者致敬!您可以免费使用该脚本,但请记住,重新发布代码须遵守我们的网站规则。
免责声明
这些信息和出版物并非旨在提供,也不构成TradingView提供或认可的任何形式的财务、投资、交易或其他类型的建议或推荐。请阅读使用条款了解更多信息。
开源脚本
秉承TradingView的精神,该脚本的作者将其开源,以便交易者可以查看和验证其功能。向作者致敬!您可以免费使用该脚本,但请记住,重新发布代码须遵守我们的网站规则。
免责声明
这些信息和出版物并非旨在提供,也不构成TradingView提供或认可的任何形式的财务、投资、交易或其他类型的建议或推荐。请阅读使用条款了解更多信息。