INVITE-ONLY SCRIPT
MBY_Quant_Hercules
已更新

Hello.
This is MBY Lab.
We are very excited to deploy Hercules metrics.
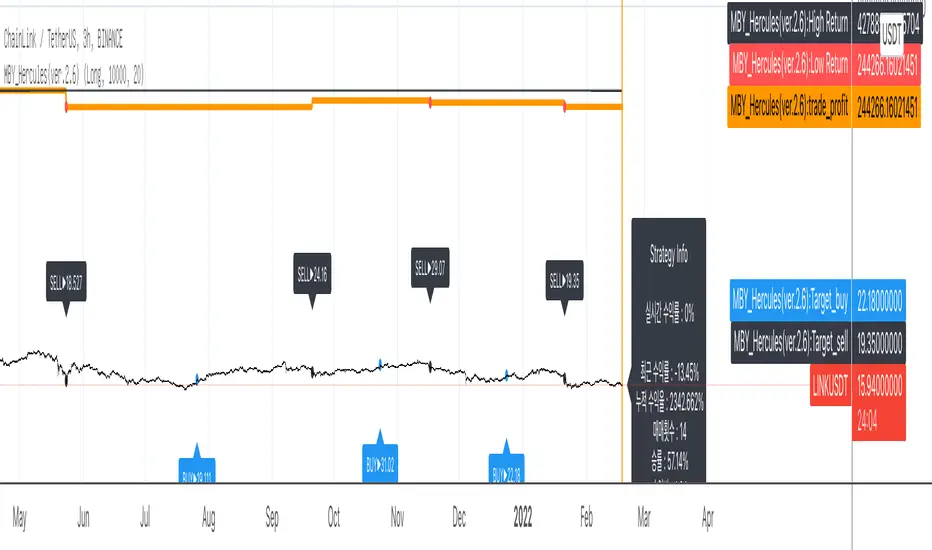
Hercules strategy operates based on the Relative Strength Index , and displays the price when each Relative Strength Index maintains an upward trend or decreases.
When the stock price rises, the price at the time of entering the overbought or oversold section is displayed as the market price, or when the relative strength index falls when the stock price rises, it is captured and the market price is displayed.
Therefore, this indicator is a momentum indicator , and it can be said to be a non-trend following indicator.
The blue line that outputs as blue shows a graph of the asset change when buying or selling at the price pointed to by this indicator, including 0.2% slippage and 0.2% transaction fee.
Of course, this doesn't mean that this metric is always profitable.
This strategy was created to aid trading.
This indicator is a private indicator, please comment if you wish to use it.
**notice**
"Use the link(Invite only script Contact) below to obtain access to this indicator".
版本注释
Huge Changing is Here!finally MBY_LAB support "Auto Mode Trading signal"
In Auto mode, Hercules determines the direction of the market by itself and dynamically sets the long and short position strategies.
Unfortunately, the auto mode included in this patch is only available for Bitcoin and Ethereum.
版本注释
color patch版本注释
color condition patch.版本注释
2.2 version release!!Alert condition Added (will delete soon).
Auto mode added.
版本注释
edit alert condition.版本注释
version release!!!2.3.5 version update.
NEW ticker support!! : ZEN!!!
版本注释
support CRV, FTT版本注释
uniswap added.!!P/L label added!!
版本注释
P/L label update.版本注释
version updated.版本注释
Ticker COMP! Added版本注释
change version,.版本注释
Grayscale's ticker "ZEC" added版本注释
Now, we support "STX"!! enjoy!
版本注释
option changed版本注释
2.42 version Update.版本注释
color code patched版本注释
signal confirm fixed.版本注释
version update.版本注释
auto fixed版本注释
CRVUNI
COMP
YFI
patched.
版本注释
version patched.版本注释
version update.dislisting some alts coins.
版本注释
fixed版本注释
fixed版本注释
fixed版本注释
script language updated 4->5telegram channel :
t.me/noah_technologies
t.me/noah_technologies
免责声明
这些信息和出版物并不意味着也不构成TradingView提供或认可的金融、投资、交易或其它类型的建议或背书。请在使用条款阅读更多信息。