PROTECTED SOURCE SCRIPT
Relative Measured Volatility [Seven Campbell]
Relative Measured Volatility
Overview:
This indicator measures the current daily volatility of an asset and compares it to the average volatility observed over the past 15 days. It provides a dynamic gauge of how much the market’s volatility is deviating from its recent historical norms.
Key Features:
Dynamic Comparison: The indicator calculates the standard deviation of daily price changes over a user-defined period (default is 14 days) and compares it to a smoothed average of this volatility over the last 15 days. This creates a "moving measuring stick" to highlight periods of unusually high or low volatility.
Customizable Settings:
Lookback Period: Set to 15 days by default, this period defines the historical window used to calculate the average volatility.
Volatility Length: Adjustable length (default is 14) for the standard deviation calculation, allowing you to fine-tune the sensitivity of the volatility measurement.
Smoothing Length: Set to 50 by default, this parameter smooths the volatility data to highlight longer-term trends.
How It Works:
Volatility Calculation: The indicator computes the daily returns using the logarithmic change in closing prices. It then calculates the standard deviation of these returns over the specified volatility length.
Smoothing: The standard deviation values are smoothed using a simple moving average over the smoothing length, providing a clearer view of trends.
Relative Measurement: The current daily volatility is divided by the smoothed volatility, giving a relative value. A value above 1 indicates higher volatility than the average over the past 15 days, while a value below 1 suggests lower volatility.
Visual Representation:
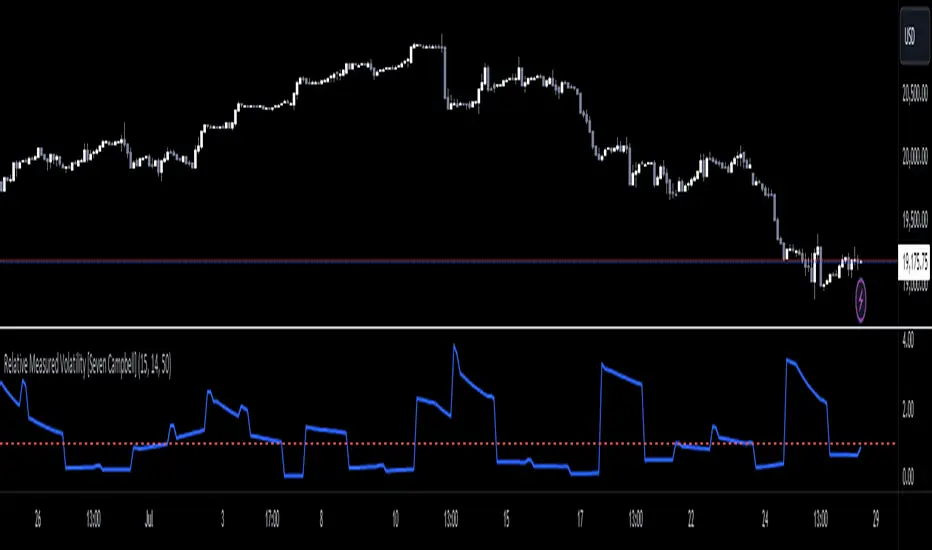
Line Plot: The relative volatility is plotted as a line, allowing you to quickly see changes in volatility relative to the historical average.
Reference Line: A horizontal line at 1 is included for easy reference. Values above this line indicate periods of higher-than-average volatility, and values below suggest lower-than-average volatility.
Use Cases:
Market Sentiment Analysis: Identify periods of high or low volatility to gauge market sentiment.
Trade Timing: Use the indicator to decide on entry and exit points, especially in volatile or calm market conditions.
Risk Management: Monitor volatility to adjust position sizes and stop-loss levels dynamically.
Example Usage:
When the line rises above 1, it signals increasing volatility, which may be a good time to take profit or adjust your stop-loss orders.
When the line drops below 1, it indicates lower volatility, potentially highlighting a stable market period.
Overview:
This indicator measures the current daily volatility of an asset and compares it to the average volatility observed over the past 15 days. It provides a dynamic gauge of how much the market’s volatility is deviating from its recent historical norms.
Key Features:
Dynamic Comparison: The indicator calculates the standard deviation of daily price changes over a user-defined period (default is 14 days) and compares it to a smoothed average of this volatility over the last 15 days. This creates a "moving measuring stick" to highlight periods of unusually high or low volatility.
Customizable Settings:
Lookback Period: Set to 15 days by default, this period defines the historical window used to calculate the average volatility.
Volatility Length: Adjustable length (default is 14) for the standard deviation calculation, allowing you to fine-tune the sensitivity of the volatility measurement.
Smoothing Length: Set to 50 by default, this parameter smooths the volatility data to highlight longer-term trends.
How It Works:
Volatility Calculation: The indicator computes the daily returns using the logarithmic change in closing prices. It then calculates the standard deviation of these returns over the specified volatility length.
Smoothing: The standard deviation values are smoothed using a simple moving average over the smoothing length, providing a clearer view of trends.
Relative Measurement: The current daily volatility is divided by the smoothed volatility, giving a relative value. A value above 1 indicates higher volatility than the average over the past 15 days, while a value below 1 suggests lower volatility.
Visual Representation:
Line Plot: The relative volatility is plotted as a line, allowing you to quickly see changes in volatility relative to the historical average.
Reference Line: A horizontal line at 1 is included for easy reference. Values above this line indicate periods of higher-than-average volatility, and values below suggest lower-than-average volatility.
Use Cases:
Market Sentiment Analysis: Identify periods of high or low volatility to gauge market sentiment.
Trade Timing: Use the indicator to decide on entry and exit points, especially in volatile or calm market conditions.
Risk Management: Monitor volatility to adjust position sizes and stop-loss levels dynamically.
Example Usage:
When the line rises above 1, it signals increasing volatility, which may be a good time to take profit or adjust your stop-loss orders.
When the line drops below 1, it indicates lower volatility, potentially highlighting a stable market period.
受保护脚本
此脚本以闭源形式发布。 但是,您可以自由使用,没有任何限制 — 了解更多信息这里。
免责声明
这些信息和出版物并非旨在提供,也不构成TradingView提供或认可的任何形式的财务、投资、交易或其他类型的建议或推荐。请阅读使用条款了解更多信息。
受保护脚本
此脚本以闭源形式发布。 但是,您可以自由使用,没有任何限制 — 了解更多信息这里。
免责声明
这些信息和出版物并非旨在提供,也不构成TradingView提供或认可的任何形式的财务、投资、交易或其他类型的建议或推荐。请阅读使用条款了解更多信息。