PROTECTED SOURCE SCRIPT
Khate ravand
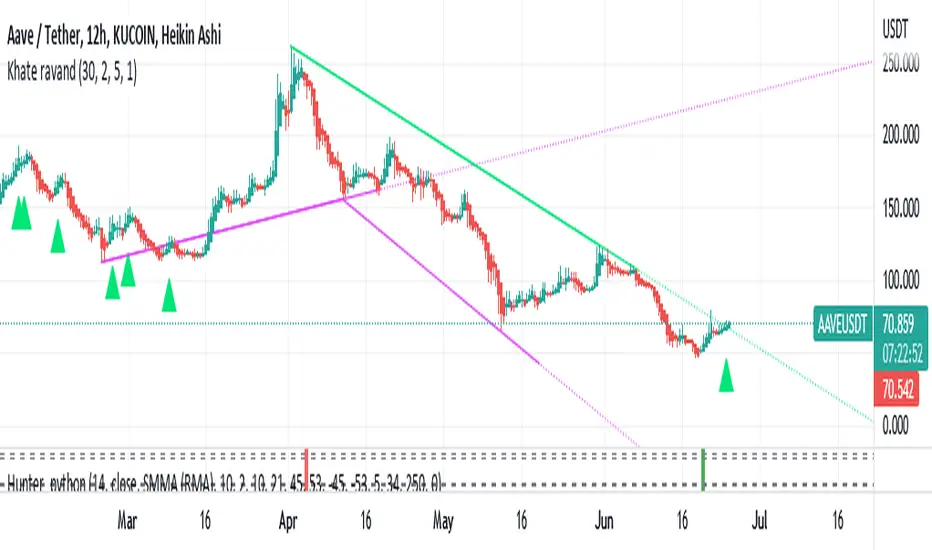
This script draws trendlines from the pivot points in the price chart.
//
// The input for the function that draws the trendlines is any calculation or function
// (here this is pivot points, but the core of the script can be used in other implementations too),
// that most of the time and occasionally produces a 'non n/a' value.
// The trendline function then connects the non n/a values and extends the connections of those points in a trendline.
//
// There is an option to draw the lines from the wicks or from the 'real bodies' of the candles.
// The trendlines can either extend infinitely or only run for an adjustable amount of bars.
//
// There's an option to display trendline breaks
// And the option to display trendlines in color or monochrome
//
//
// The input for the function that draws the trendlines is any calculation or function
// (here this is pivot points, but the core of the script can be used in other implementations too),
// that most of the time and occasionally produces a 'non n/a' value.
// The trendline function then connects the non n/a values and extends the connections of those points in a trendline.
//
// There is an option to draw the lines from the wicks or from the 'real bodies' of the candles.
// The trendlines can either extend infinitely or only run for an adjustable amount of bars.
//
// There's an option to display trendline breaks
// And the option to display trendlines in color or monochrome
//
受保护脚本
此脚本以闭源形式发布。 但是,您可以自由使用,没有任何限制 — 了解更多信息这里。
免责声明
这些信息和出版物并非旨在提供,也不构成TradingView提供或认可的任何形式的财务、投资、交易或其他类型的建议或推荐。请阅读使用条款了解更多信息。
免责声明
这些信息和出版物并非旨在提供,也不构成TradingView提供或认可的任何形式的财务、投资、交易或其他类型的建议或推荐。请阅读使用条款了解更多信息。