OPEN-SOURCE SCRIPT
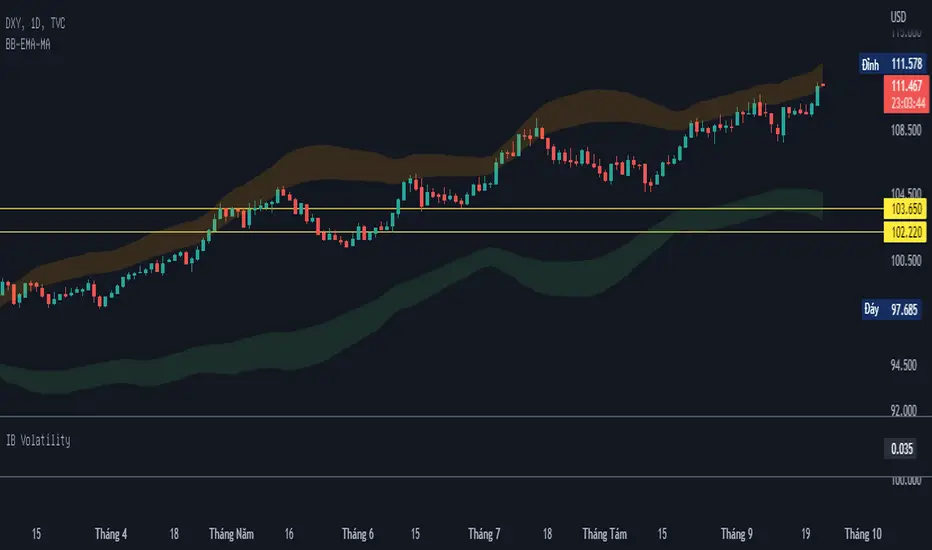
BB-EMA-MA

Wikipedia: Bollinger Bands are a type of statistical chart characterizing the prices and volatility over time of a financial instrument or commodity, using a formulaic method propounded by John Bollinger in the 1980s. Financial traders employ these charts as a methodical tool to inform trading decisions, control automated trading systems, or as a component of technical analysis. Bollinger Bands display a graphical band (the envelope maximum and minimum of moving averages, similar to Keltner or Donchian channels) and volatility (expressed by the width of the envelope) in one two-dimensional chart.
If you set Type = 2 then it will use EMA average for Bollinger bands .
If you set Type = 1 then it will use MA average for Bollinger bands .
Default settings is moving average with period 50
When price move to standard Deviation (std) +2 and std +3 is signal for sell ( selling zone)
When price move to standard Deviation (std) -2 and std -3 is signal for sell ( buying zone)
版本注释
Add one more Bollinger Band, change some default settings开源脚本
秉承TradingView的精神,该脚本的作者将其开源,以便交易者可以查看和验证其功能。向作者致敬!您可以免费使用该脚本,但请记住,重新发布代码须遵守我们的网站规则。
免责声明
这些信息和出版物并非旨在提供,也不构成TradingView提供或认可的任何形式的财务、投资、交易或其他类型的建议或推荐。请阅读使用条款了解更多信息。
开源脚本
秉承TradingView的精神,该脚本的作者将其开源,以便交易者可以查看和验证其功能。向作者致敬!您可以免费使用该脚本,但请记住,重新发布代码须遵守我们的网站规则。
免责声明
这些信息和出版物并非旨在提供,也不构成TradingView提供或认可的任何形式的财务、投资、交易或其他类型的建议或推荐。请阅读使用条款了解更多信息。