OPEN-SOURCE SCRIPT
已更新 Fixed RSI Overlay [lognomics]
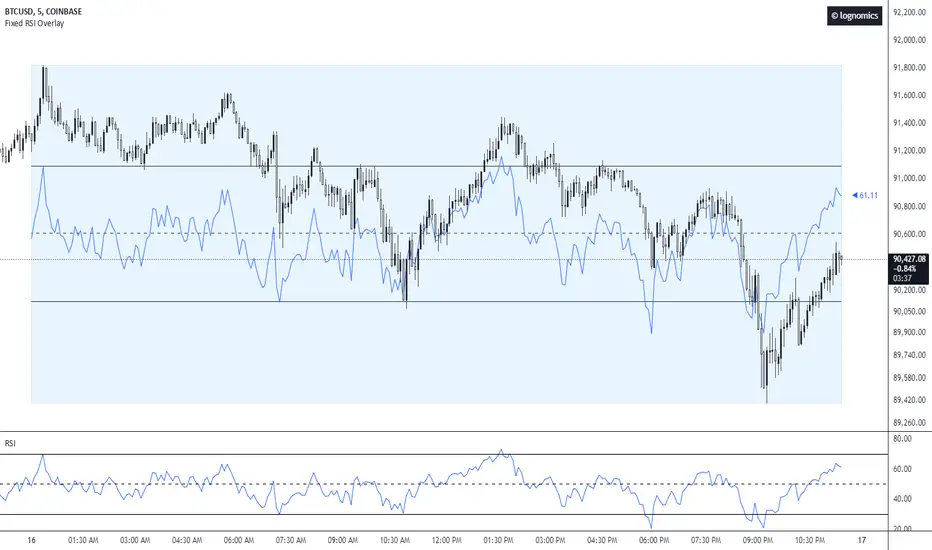
This overlay indicator provides a dynamic visualization of the RSI on the instrument price chart. It enhances the standard RSI oscillator by scaling it relative to the anchor's maximum & minimum range, conceptualizing how price reacts at standard oscillation levels.
Starting at the anchor's open, the tool collects all the RSI values from each candle within the range, and stores them inside an array corresponding to each candle index. It then pulls relative values and plots a line connecting each point accordingly to the 0-100 range scale.
While determining each maximum and/or minimum the script will plot a box from the opening time of the anchor, encapsulating the high & low of the range, to end at the next anchor time. To the right to of the box, a label is plotted which is pushed to the current time & current RSI y value within the fixed scale.
版本注释
Universal time-zone input & styling.版本注释
Bug fixes.版本注释
Lookback bar anchor & stochastic plot setting.开源脚本
秉承TradingView的精神,该脚本的作者将其开源,以便交易者可以查看和验证其功能。向作者致敬!您可以免费使用该脚本,但请记住,重新发布代码须遵守我们的网站规则。
免责声明
这些信息和出版物并非旨在提供,也不构成TradingView提供或认可的任何形式的财务、投资、交易或其他类型的建议或推荐。请阅读使用条款了解更多信息。
免责声明
这些信息和出版物并非旨在提供,也不构成TradingView提供或认可的任何形式的财务、投资、交易或其他类型的建议或推荐。请阅读使用条款了解更多信息。