OPEN-SOURCE SCRIPT
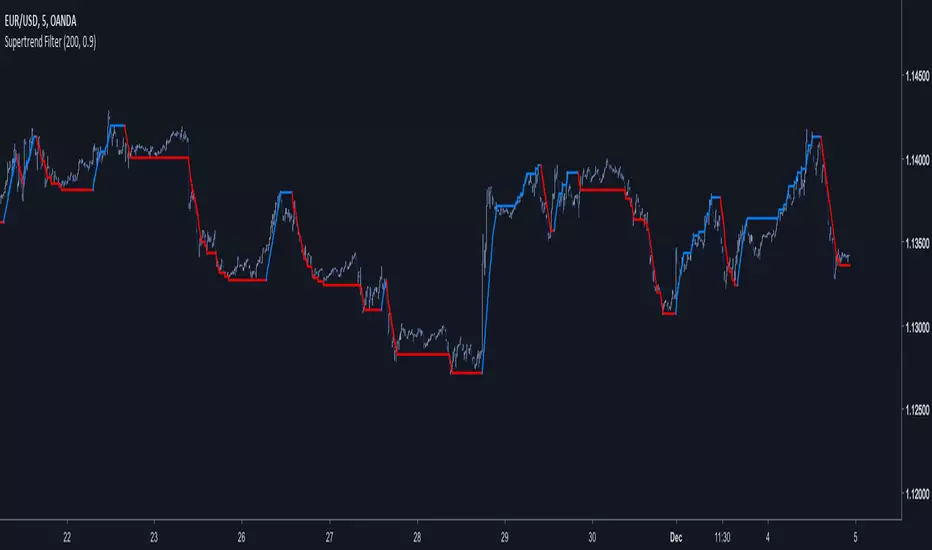
Supertrend Filter

A derivation of the famous SuperTrend indicator.
My motivation for such indicator was to use more recursion in the original SuperTrend code, this work was made quite fast but feel free to modify it, as always my work is more for inspirational use than anything else so i hope it will inspire you to get more involved with the SuperTrend code or to start coding with Pine.
The indicator no longer act as a trailing-stop but more like a filter, this is due to the fact that the indicator conditions are swapped and that the output is reused many times in the calculation.
Parameters change as well and involve particular gestion. The Factor Parameter is no longer an integer but decimals such that 0 < Factor < 1.
When the Period is high the indicator tend to become less linear/static and look more like a classic moving average.So it is important to have higher Factor values when the Period is high and reciprocally.Here a table to help you with parameters settings :
for Period = 1 to 50 Factor = 0.5
for Period = 50 to 100 Factor = 0.6
for Period = 100 to 150 Factor = 0.7
for Period = 150 to 200 Factor = 0.8
for Period = 200 to 300 Factor = 0.9
There could be a formula to scale the Factor depending on the Period but there would be no proof that the scaling method used is optimal.
Hope you enjoy
For any questions/demands feel free to pm me, i would be happy to help you
开源脚本
秉承TradingView的精神,该脚本的作者将其开源,以便交易者可以查看和验证其功能。向作者致敬!您可以免费使用该脚本,但请记住,重新发布代码须遵守我们的网站规则。
Check out the indicators we are making at luxalgo: tradingview.com/u/LuxAlgo/
"My heart is so loud that I can't hear the fireworks"
"My heart is so loud that I can't hear the fireworks"
免责声明
这些信息和出版物并非旨在提供,也不构成TradingView提供或认可的任何形式的财务、投资、交易或其他类型的建议或推荐。请阅读使用条款了解更多信息。