OPEN-SOURCE SCRIPT
Bitcoin Power Law Oscillator [InvestorUnknown]
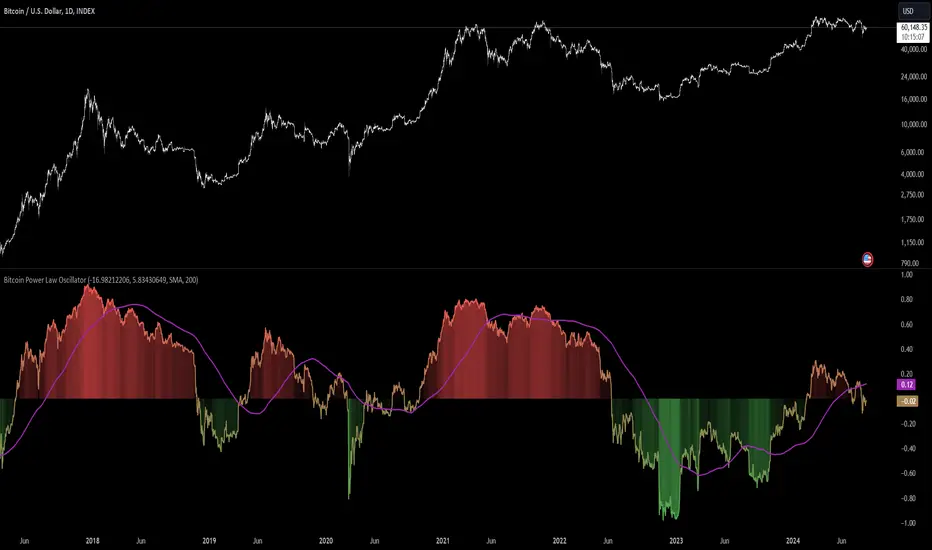
The Bitcoin Power Law Oscillator is a specialized tool designed for long-term mean-reversion analysis of Bitcoin's price relative to a theoretical midline derived from the Bitcoin Power Law model (made by capriole_charles). This oscillator helps investors identify whether Bitcoin is currently overbought, oversold, or near its fair value according to this mathematical model.

Key Features:
Pine Script®
Pine Script®
This indicator is particularly useful for long-term Bitcoin investors who wish to gauge the market's mean-reversion tendencies based on a well-established theoretical model. By focusing on the Power Law’s midline, users can gain insights into whether Bitcoin’s current price deviates significantly from what historical trends would suggest as a fair value.
Key Features:
- Power Law Model Integration: The oscillator is based on the midline of the Bitcoin Power Law, which is calculated using regression coefficients (A and B) applied to the logarithm of the number of days since Bitcoin’s inception. This midline represents a theoretical fair value for Bitcoin over time.
- Midline Distance Calculation: The distance between Bitcoin’s current price and the Power Law midline is computed as a percentage, indicating how far above or below the price is from this theoretical value.
float a = input.float (-16.98212206, 'Regression Coef. A', group = "Power Law Settings")
float b = input.float (5.83430649, 'Regression Coef. B', group = "Power Law Settings")
normalization_start_date = timestamp(2011,1,1)
calculation_start_date = time == timestamp(2010, 7, 19, 0, 0) // First BLX Bitcoin Date
int days_since = request.security('BNC:BLX', 'D', ta.barssince(calculation_start_date))
bar() =>
[open, high, low, close]
[btc_open, btc_high, btc_low, btc_close] = request.security('BNC:BLX', 'D', bar())
int offset = 564 // days between 2009/1/1 and "calculation_start_date"
int days = days_since + offset
float e = a + b * math.log10(days)
float y = math.pow(10, e)
float midline_distance = math.round((y / btc_close - 1.0) * 100)
- Oscillator Normalization: The raw distance is converted into a normalized oscillator, which fluctuates between -1 and 1. This normalization adjusts the oscillator to account for historical extremes, making it easier to compare current conditions with past market behavior.
float oscillator = -midline_distance
var float min = na
var float max = na
if (oscillator > max or na(max)) and time >= normalization_start_date
max := oscillator
if (min > oscillator or na(min)) and time >= normalization_start_date
min := oscillator
rescale(float value, float min, float max) =>
(2 * (value - min) / (max - min)) - 1
normalized_oscillator = rescale(oscillator, min, max)
- Overbought/Oversold Identification: The oscillator provides a clear visual representation, where values near 1 suggest Bitcoin is overbought, and values near -1 indicate it is oversold. This can help identify potential reversal points or areas of significant market imbalance.
- Optional Moving Average: Users can overlay a moving average (either SMA or EMA) on the oscillator to smooth out short-term fluctuations and focus on longer-term trends. This is particularly useful for confirming trend reversals or persistent overbought/oversold conditions.
This indicator is particularly useful for long-term Bitcoin investors who wish to gauge the market's mean-reversion tendencies based on a well-established theoretical model. By focusing on the Power Law’s midline, users can gain insights into whether Bitcoin’s current price deviates significantly from what historical trends would suggest as a fair value.
开源脚本
秉承TradingView的精神,该脚本的作者将其开源,以便交易者可以查看和验证其功能。向作者致敬!您可以免费使用该脚本,但请记住,重新发布代码须遵守我们的网站规则。
免责声明
这些信息和出版物并非旨在提供,也不构成TradingView提供或认可的任何形式的财务、投资、交易或其他类型的建议或推荐。请阅读使用条款了解更多信息。
开源脚本
秉承TradingView的精神,该脚本的作者将其开源,以便交易者可以查看和验证其功能。向作者致敬!您可以免费使用该脚本,但请记住,重新发布代码须遵守我们的网站规则。
免责声明
这些信息和出版物并非旨在提供,也不构成TradingView提供或认可的任何形式的财务、投资、交易或其他类型的建议或推荐。请阅读使用条款了解更多信息。