INVITE-ONLY SCRIPT
已更新 Reversal Pivot
Overview
Introducing the Reversal Pivot indicator - a tool for identifying potential reversal points in price. This algorithm takes into account multiple factors, including price action, volume, and pivot points, to give you a clear and accurate picture of where the market is heading to.
How it works
The indicator gets expansions and the highs and lows and uses the conditions along with pivots to determine whether a reversal is possible or not. Then it gets the volume to determine how strong this chance of reversal is.
How to use
The Reversal Pivot indicator alone shouldn't be used to find reversal points but it helps you get a clear insight on where possible reversals could happen for example, you could use it with mean reversion strategies to find the best entries.
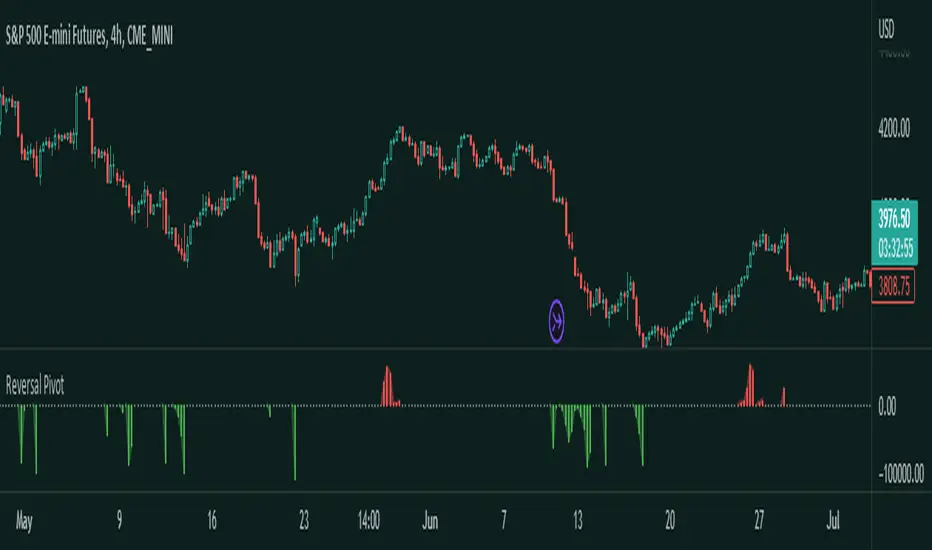
Red bars signal a bearish reversal
Green bars signal a bullish reversal
This here is an example of a long entry if you are trading lets say the mean. You can wait for a bullish reversal on the Histogram plot and then enter, a reversal could happen.
This is an example of a short entry if you are also trading the mean.
Other features
This indicator allows you to customize the colors, and the histogram. If you don't like the histogram then you can change its plot style to whatever you would like.
Try the Reversal Pivot indicator today and find more possible reversal points!
版本注释
Renamed the labels to make it more user convenient.版本注释
Description Update仅限邀请脚本
只有作者授权的用户才能访问此脚本。您需要申请并获得使用许可。通常情况下,付款后即可获得许可。更多详情,请按照下方作者的说明操作,或直接联系Traders_Endeavors。
TradingView不建议您付费购买或使用任何脚本,除非您完全信任其作者并了解其工作原理。您也可以在我们的社区脚本找到免费的开源替代方案。
作者的说明
Get instant access here: https://www.patreon.com/user?u=80987417
Link Tree: linktr.ee/tradersendeavors
Access our indicators: patreon.com/user?u=80987417
Access our indicators: patreon.com/user?u=80987417
免责声明
这些信息和出版物并非旨在提供,也不构成TradingView提供或认可的任何形式的财务、投资、交易或其他类型的建议或推荐。请阅读使用条款了解更多信息。
仅限邀请脚本
只有作者授权的用户才能访问此脚本。您需要申请并获得使用许可。通常情况下,付款后即可获得许可。更多详情,请按照下方作者的说明操作,或直接联系Traders_Endeavors。
TradingView不建议您付费购买或使用任何脚本,除非您完全信任其作者并了解其工作原理。您也可以在我们的社区脚本找到免费的开源替代方案。
作者的说明
Get instant access here: https://www.patreon.com/user?u=80987417
Link Tree: linktr.ee/tradersendeavors
Access our indicators: patreon.com/user?u=80987417
Access our indicators: patreon.com/user?u=80987417
免责声明
这些信息和出版物并非旨在提供,也不构成TradingView提供或认可的任何形式的财务、投资、交易或其他类型的建议或推荐。请阅读使用条款了解更多信息。