OPEN-SOURCE SCRIPT
已更新 Institutions vs. Crypto Whales Spot Buying

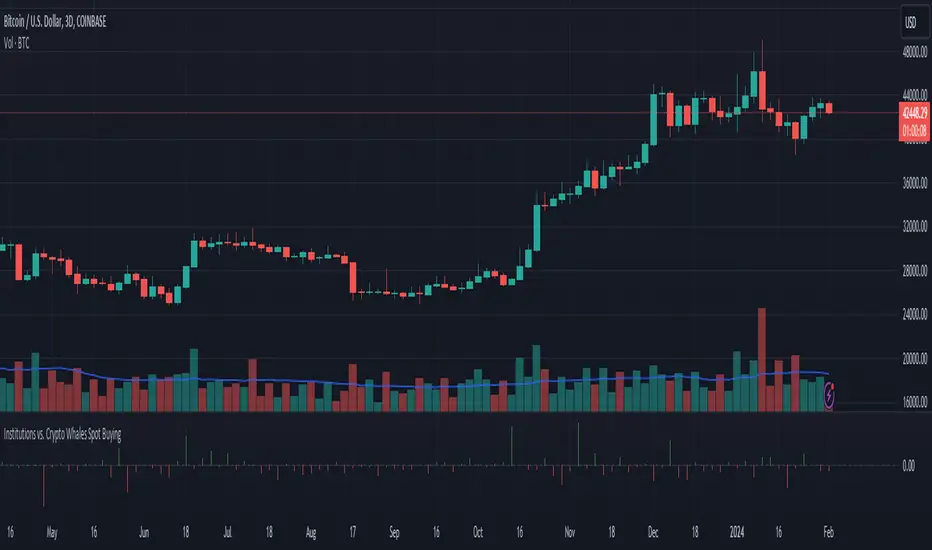
Based on analysis from tedtalksmacro, I have put together a similar tool that helps to visualise whether institutions (Coinbase and Deribit) or native crypto whales (Binance and Bitfinex) are leading the BTC spot buying.
This is plotted as the normalised relative difference (-1 and 1) between the average of Coinbase and Deribit spot price versus Binance and Bitfinex. If positive (i.e. green bar), institutions are trading at a premium; if negative (i.e. red bar), crypto whales are trading at a premium.
For example, if crypto whales are trading at a premium and price is increasing, then they are leading the buying relative to institutions. However, if whales are trading at a premium and price is decreasing, then it is likely institutions are selling off at a more rapid rate relative to the crypto whales buying pressure. This applies to the alternate scenario where institutions are trading at a premium to crypto whales.
In recent times, native crypto whales (largely Binance) drove the push from 40 to 48k, but then also marked the local top with a major sell off at this price. Institutions then took over buying at the most recent lows, driven largely by GBTC outflows slowing down and Blackrock daily inflows exceeding Grayscale outflows for the first time late last week.
版本注释
Minor cosmetic updates to script开源脚本
In true TradingView spirit, the creator of this script has made it open-source, so that traders can review and verify its functionality. Kudos to the author! While you can use it for free, remember that republishing the code is subject to our House Rules.
免责声明
The information and publications are not meant to be, and do not constitute, financial, investment, trading, or other types of advice or recommendations supplied or endorsed by TradingView. Read more in the Terms of Use.
开源脚本
In true TradingView spirit, the creator of this script has made it open-source, so that traders can review and verify its functionality. Kudos to the author! While you can use it for free, remember that republishing the code is subject to our House Rules.
免责声明
The information and publications are not meant to be, and do not constitute, financial, investment, trading, or other types of advice or recommendations supplied or endorsed by TradingView. Read more in the Terms of Use.