OPEN-SOURCE SCRIPT
已更新 RedK VADER - Volume-Accelerated Directional Energy Ratio

RedK VADER - Volume-Accelerated Directional Energy Ratio
Overview
RedK VADER is an indicator that analyzes market trends by calculating the energy ratio based on price movement and volume. It utilizes Zero Lag EMA smoothing to provide faster and more responsive signals.
Features
✅ Considers both price action and volume: Calculates the energy ratio of upward and downward movements to assess market strength.
✅ Zero Lag Smoothing: Uses EMA-based smoothing to minimize lag and improve responsiveness.
✅ Histogram Display: Helps visualize trend strength and potential reversals.
✅ Simple yet effective: Uses short-term and long-term energy differences to generate intuitive trade signals.
How to Use
📌 Blue Line (RedK VADER): Indicates trend direction and strength.
📌 Orange Line (Signal Line): A smoothed version of VADER; crossovers provide trade signals.
📌 Histogram (Green Bars): Represents the difference between VADER and the signal line. When crossing the zero line, it may indicate a trend reversal.
Trade Signals
🔵 Buy Signal: When RedK VADER crosses above the signal line.
🔴 Sell Signal: When RedK VADER crosses below the signal line.
⚡ Trend Strength: The larger the histogram bars, the stronger the trend.
Use this indicator to gain deeper market insights and enhance your trading decisions! 🚀
版本注释
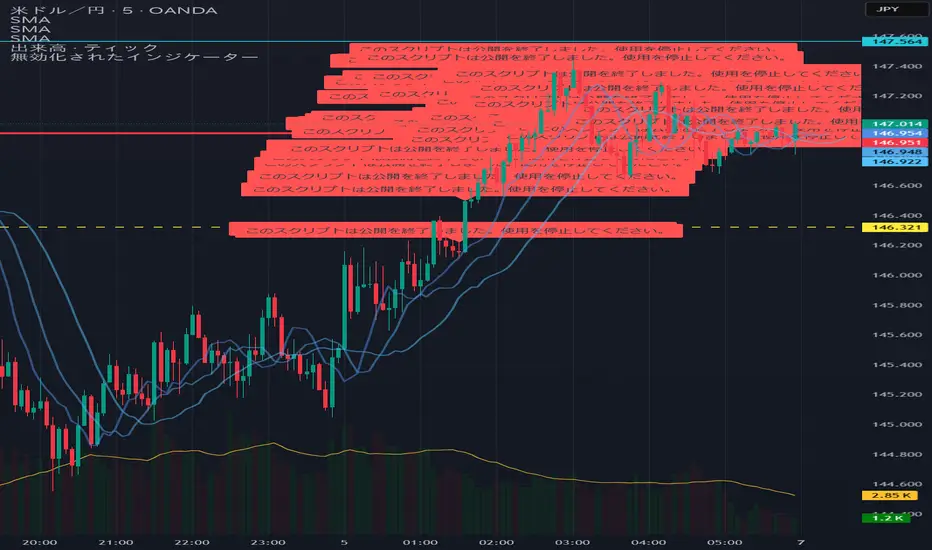
This script is no longer supported or maintained.The indicator is no longer available for public use.
Please remove it from your chart if you are still using it.
Thank you for your understanding.
版本注释
This script is no longer supported or maintained.The indicator is no longer available for public use.
Please remove it from your chart if you are still using it.
Thank you for your understanding.
开源脚本
秉承TradingView的精神,该脚本的作者将其开源,以便交易者可以查看和验证其功能。向作者致敬!您可以免费使用该脚本,但请记住,重新发布代码须遵守我们的网站规则。
免责声明
这些信息和出版物并非旨在提供,也不构成TradingView提供或认可的任何形式的财务、投资、交易或其他类型的建议或推荐。请阅读使用条款了解更多信息。
开源脚本
秉承TradingView的精神,该脚本的作者将其开源,以便交易者可以查看和验证其功能。向作者致敬!您可以免费使用该脚本,但请记住,重新发布代码须遵守我们的网站规则。
免责声明
这些信息和出版物并非旨在提供,也不构成TradingView提供或认可的任何形式的财务、投资、交易或其他类型的建议或推荐。请阅读使用条款了解更多信息。