OPEN-SOURCE SCRIPT
Basic ORB [MOT]
Basic ORB [MOT] – Opening Range Breakout Tool
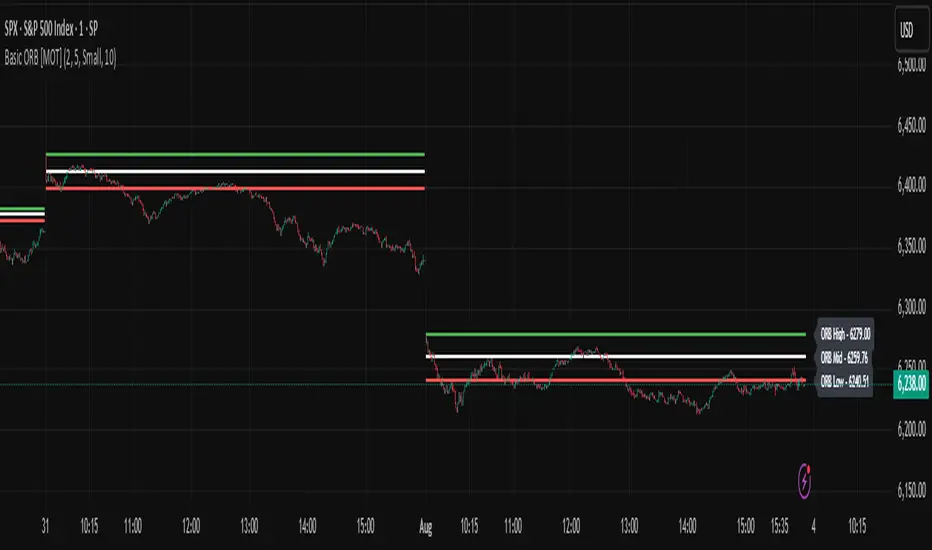
The Basic ORB [MOT] is a visual tool designed to assist intraday traders by identifying the opening range from 9:30–9:45 AM ET. It automatically plots the high, low, and midpoint of this range to help traders analyze potential areas of interest.
This script provides a simple and customizable way to frame market structure during the early trading session. It is intended to support various intraday strategies across multiple asset classes including futures, stocks, ETFs, indexes, and crypto.
🔹 Key Features
1. Opening Range Levels
- Automatically plots the High, Low, and Midline of the 9:30–9:45 AM ET session.
- Midline helps visualize the midpoint of the range.
- Customizable colors and line thickness.
2. Previous ORB Ranges
- Option to display previous days’ ORB levels for visual pattern recognition.
- Useful for spotting recurring reactions to prior day levels.
3. Dynamic Price Labels
- Adds price labels to each ORB line for quick reference.
- Fully customizable: adjust text size, background color, label position, and offset.
4. Clean Settings Panel
- Customize all visual elements to match your charting style.
- Control how many previous ORBs to display.
- Toggle features on or off for a simplified interface.
🧠 How to Use
- Best viewed on 1m, 5m, or 15m charts.
- Combine with your existing entry/exit criteria to monitor how price interacts with the opening range.
- Common use cases include breakout confirmation, rejection trades, and support/resistance analysis based on prior ORBs.
⚠️ Disclaimer
This script is for educational and informational purposes only. It does not constitute financial advice. Trading carries risk, and users should test any tools in a demo environment before live use. Always implement proper risk management.
开源脚本
秉承TradingView的精神,该脚本的作者将其开源,以便交易者可以查看和验证其功能。向作者致敬!您可以免费使用该脚本,但请记住,重新发布代码须遵守我们的网站规则。
免责声明
这些信息和出版物并非旨在提供,也不构成TradingView提供或认可的任何形式的财务、投资、交易或其他类型的建议或推荐。请阅读使用条款了解更多信息。
开源脚本
秉承TradingView的精神,该脚本的作者将其开源,以便交易者可以查看和验证其功能。向作者致敬!您可以免费使用该脚本,但请记住,重新发布代码须遵守我们的网站规则。
免责声明
这些信息和出版物并非旨在提供,也不构成TradingView提供或认可的任何形式的财务、投资、交易或其他类型的建议或推荐。请阅读使用条款了解更多信息。