OPEN-SOURCE SCRIPT
已更新 Candle Theory
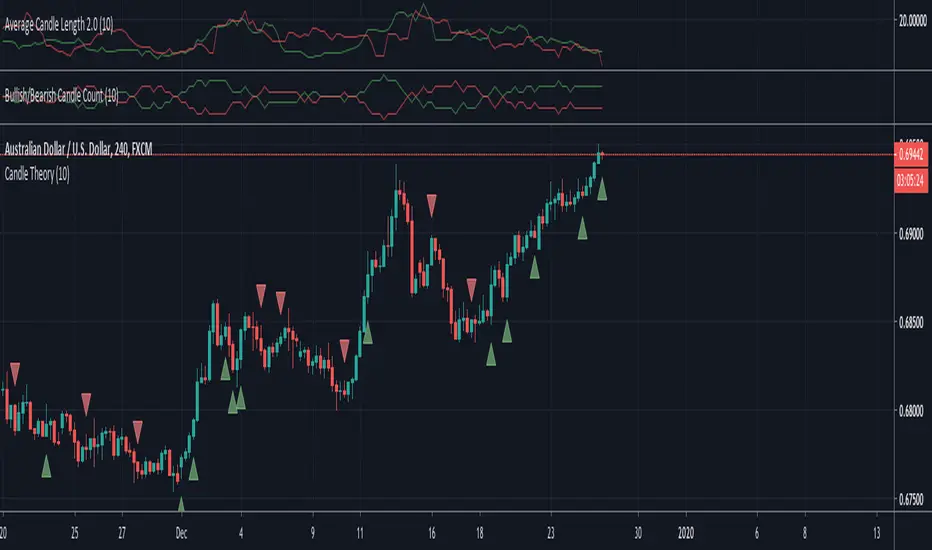
Description: The theory behind this script is that if within the last 10 candles, if the majority of them are green and the average length (wick to wick) of those majority green candles is greater than the average length of the minority red candles then it will signal that this is a bullish move within the market and signal you to buy. The opposite is true for bearish moves.
Inputs:
Inputs:
- Length - this allows you to decide how many candles to look back, default/recommended is 10
- Show First Signal In Series Only - using this indicator without this checked will show many more signals in a row. This allows you to just get a signal for the first candle that is the predicted bullish or bearish move
版本注释
Adding in an alertcondition that allows you to set up one alert for short or long signals rather than having to set up two different alerts.开源脚本
秉承TradingView的精神,该脚本的作者将其开源,以便交易者可以查看和验证其功能。向作者致敬!您可以免费使用该脚本,但请记住,重新发布代码须遵守我们的网站规则。
免责声明
这些信息和出版物并非旨在提供,也不构成TradingView提供或认可的任何形式的财务、投资、交易或其他类型的建议或推荐。请阅读使用条款了解更多信息。
免责声明
这些信息和出版物并非旨在提供,也不构成TradingView提供或认可的任何形式的财务、投资、交易或其他类型的建议或推荐。请阅读使用条款了解更多信息。