OPEN-SOURCE SCRIPT
Bollinger Bands cross %
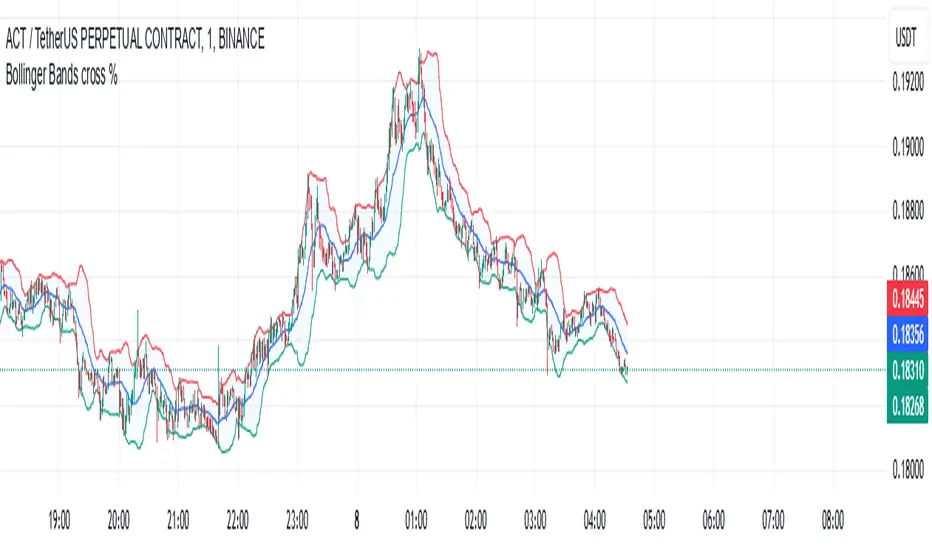
The BB strategy (Bollinger Bands strategy) on TradingView utilizes the Bollinger Bands indicator to help traders identify market volatility and potential entry points. The Bollinger Bands indicator consists of three main components:
Middle Band: This is the simple moving average (SMA), usually calculated over a 20-period. It represents the average price over a specific period.
Upper Band and Lower Band: These bands are created by adding and subtracting a multiple of the standard deviation (typically 2) from the middle band. The upper and lower bands help determine the level of price volatility.
How the BB Strategy Works:
Break above the Upper Band: When the price moves above the upper band, it might signal that the market is in an "overbought" condition. This could be a sign to consider selling, but it could also continue if the trend is strong.
Break below the Lower Band: When the price moves below the lower band, it might signal that the market is in an "oversold" condition, which could be a signal to buy if the trend is reversing.
Squeeze (Coiling): When the Bollinger Bands contract, often referred to as a "squeeze," it indicates that the market may be preparing for a strong price move. This is a critical signal in the BB strategy because the narrowing bands signify low volatility and a potential breakout in price.
Specific Strategy:
Buy when price touches the lower band and shows signs of reversal (bullish reversal): If the price touches the lower band, you might wait for a reversal signal, such as a bullish candlestick pattern or confirmation from other indicators like RSI or MACD, indicating oversold conditions.
Sell when price touches the upper band and shows signs of reversal (bearish reversal): Similarly, when the price touches the upper band, you could wait for a bearish reversal signal, such as a bearish candlestick pattern or confirmation from other indicators, and then sell.
Trend-following when bands are expanding: If the Bollinger Bands are expanding and the price continues in the same direction, it could signal a trend-following opportunity.
开源脚本
秉承TradingView的精神,该脚本的作者将其开源,以便交易者可以查看和验证其功能。向作者致敬!您可以免费使用该脚本,但请记住,重新发布代码须遵守我们的网站规则。
免责声明
这些信息和出版物并非旨在提供,也不构成TradingView提供或认可的任何形式的财务、投资、交易或其他类型的建议或推荐。请阅读使用条款了解更多信息。
开源脚本
秉承TradingView的精神,该脚本的作者将其开源,以便交易者可以查看和验证其功能。向作者致敬!您可以免费使用该脚本,但请记住,重新发布代码须遵守我们的网站规则。
免责声明
这些信息和出版物并非旨在提供,也不构成TradingView提供或认可的任何形式的财务、投资、交易或其他类型的建议或推荐。请阅读使用条款了解更多信息。