OPEN-SOURCE SCRIPT
High Volume Engulfing Candle near EMAs
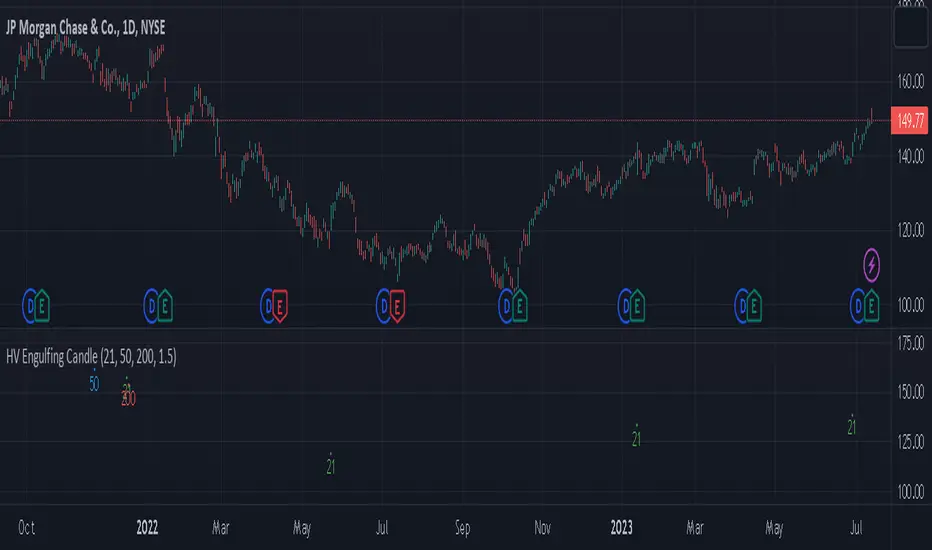
The indicator is designed to identify and signal instances of high volume and engulfing candles near three Exponential Moving Averages (EMAs): the 21EMA, 50EMA, and 200EMA. It can be used in various financial markets such as stocks, forex, commodities, or cryptocurrencies, as long as the market data is available on the TradingView platform.
Here's a breakdown of how the indicator works and its features:
High Volume Detection: The indicator considers a candle to have high volume if its volume is greater than or equal to a specified threshold. The default threshold is set to 1.5 times the 20-period Simple Moving Average (SMA) of the volume. You can adjust the volume_threshold parameter to customize the threshold according to your preferences.
Engulfing Candle Detection: An engulfing candle is identified when the current candle's range engulfs the range of the previous candle. The indicator checks if the current candle is either bullish engulfing (open[1] > close[1] and close > open[1]) or bearish engulfing (open[1] < close[1] and close < open[1]). This helps identify significant shifts in market sentiment.
Proximity to EMAs: The indicator checks if the low of the candle is below and the high is above each of the three EMAs (21EMA, 50EMA, and 200EMA). This indicates that the price action is near or interacting with these key moving averages.
When all the following conditions are met, the indicator plots shapes below the candlesticks on the chart to generate signals:
The candle has high volume (volume_threshold).
The candle is an engulfing candle.
The candle's range engulfs the 21EMA, 50EMA, or 200EMA.
The shapes are plotted with different colors and labels to indicate which EMA condition is met. Green shapes represent the 21EMA condition, blue shapes represent the 50EMA condition, and red shapes represent the 200EMA condition.
By using this indicator, traders can potentially identify significant market movements, areas of price interaction with key EMAs, and instances of high volume that may signify strong buying or selling pressure.
开源脚本
秉承TradingView的精神,该脚本的作者将其开源,以便交易者可以查看和验证其功能。向作者致敬!您可以免费使用该脚本,但请记住,重新发布代码须遵守我们的网站规则。
免责声明
这些信息和出版物并非旨在提供,也不构成TradingView提供或认可的任何形式的财务、投资、交易或其他类型的建议或推荐。请阅读使用条款了解更多信息。
开源脚本
秉承TradingView的精神,该脚本的作者将其开源,以便交易者可以查看和验证其功能。向作者致敬!您可以免费使用该脚本,但请记住,重新发布代码须遵守我们的网站规则。
免责声明
这些信息和出版物并非旨在提供,也不构成TradingView提供或认可的任何形式的财务、投资、交易或其他类型的建议或推荐。请阅读使用条款了解更多信息。