OPEN-SOURCE SCRIPT
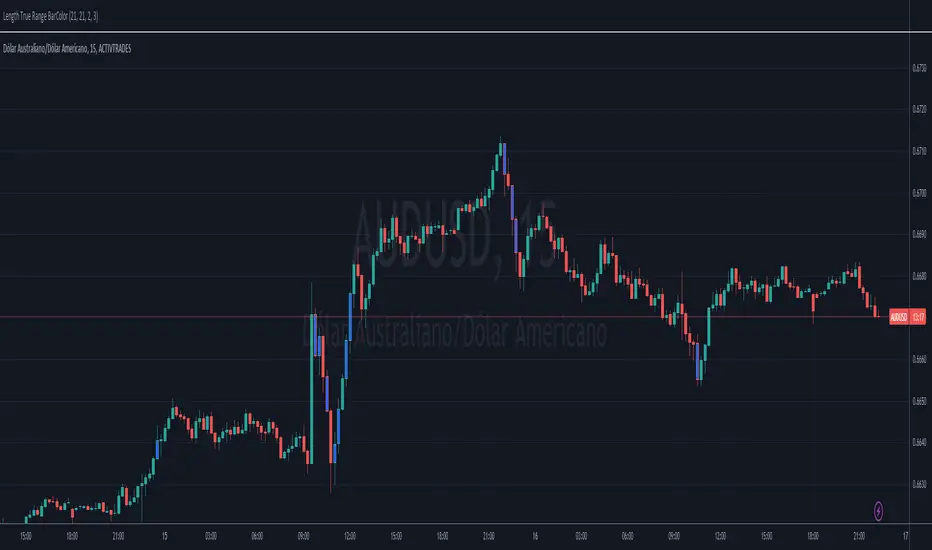
已更新 Length True Range BarColor
Overview
The indicator prints different colors on the candles for pre-determined amplitudes in relation to the simple moving average over the average true range.
Calculations
The indicated value of the simple moving average in relation to the average true range is being used to restrict the color of the candle signal to its pre-determined amplitude.
How It Works
Supposing you have a strategy where there is a need to determine the size of the acceptable signal bar in relation to the average true range, as well as size your stop and target through this range. In summary, coloring based on the size of the amplitude due to the average of the ATR, provides the ease of identifying weak signals, where there will possibly not be a sequence of movement, or identifying stretched signals where it will possibly provide a correction movement. This way you can determine an ideal size range for your input signal. Ex: Color candle signal with size of ( Candle => 2* the SMA (ATR) and <= 3* the SMA (ATR).
Inputs
Valores
Period: To determine the length of the ATR
SMA: To determine the length of the Simple Moving Average
LengthMin: Minimum amplitude size factor
LengthMax: Maximum amplitude size factor
Traço: Coloring ATR
SMA: Coloring SMA
Traço: Coloring TR
Bar Color: Coloring candle Sing
Note 1
The values of ATR, SMA and TR will normally be shown in the indicator header for a dynamic visualization of the values, and possible exceptions for candles signals outside the initially proposed factor can be compared.
Note 2
Codes made available in the PINE language reference manual were used to develop the indicator, therefore it is a practical code for trend following setup strategies not available in the community.
版本注释
Update ATR input name版本注释
Update ATR line name版本注释
Update candle amplitude line name版本注释
Imagem版本注释
change in caption >= que: length Max to <= que: length Max开源脚本
秉承TradingView的精神,该脚本的作者将其开源,以便交易者可以查看和验证其功能。向作者致敬!您可以免费使用该脚本,但请记住,重新发布代码须遵守我们的网站规则。
免责声明
这些信息和出版物并非旨在提供,也不构成TradingView提供或认可的任何形式的财务、投资、交易或其他类型的建议或推荐。请阅读使用条款了解更多信息。
免责声明
这些信息和出版物并非旨在提供,也不构成TradingView提供或认可的任何形式的财务、投资、交易或其他类型的建议或推荐。请阅读使用条款了解更多信息。