INVITE-ONLY SCRIPT
Bullish/Bearish Sentiment Cycle Indicator
Sentiment Cycle Indicator: Understanding Market Psychology Through Technical Analysis
Overview:
The Sentiment Cycle Indicator is a unique blend of multiple technical analysis tools designed to help traders visualize and capitalize on market sentiment shifts. This indicator combines RSI (Relative Strength Index), MACD (Moving Average Convergence Divergence), volume analysis, and sentiment cycle detection to provide actionable buy and sell signals. By monitoring the emotional stages that market participants go through—such as optimism, excitement, euphoria, anxiety, denial, panic, and depression—this indicator helps traders identify turning points in the market cycle.
Key Components and How They Work Together:
1. RSI (Relative Strength Index):
• The RSI is a momentum oscillator that measures the speed and change of price movements. In this indicator, the RSI is used to determine overbought or oversold conditions, which are then translated into signals for potential market sentiment shifts.
• Integration: The RSI provides the foundational layer to assess whether the market is generally bullish or bearish. When combined with MACD and volume analysis, it helps confirm the strength of a sentiment cycle phase.
2. MACD (Moving Average Convergence Divergence):
• MACD is a trend-following indicator that shows the relationship between two moving averages of a security’s price. It is used in this script to identify trend direction and momentum changes.
• Integration: MACD crossovers are aligned with RSI conditions to detect the shift between bullish and bearish market sentiments. The MACD’s ability to capture trend changes strengthens the identification of sentiment phases, such as “optimism” or “panic.”
3. Volume Analysis:
• Volume analysis is a critical component in understanding market sentiment. The indicator uses a moving average of volume to detect volume spikes, which often coincide with significant market moves or reversals.
• Integration: Volume spikes are used to gauge the intensity of sentiment changes. For example, high volume during a bullish or bearish sentiment phase is a strong confirmation of a market sentiment shift. This integration enhances the reliability of the buy and sell signals generated by the sentiment cycle logic.
4. Sentiment Cycles:
• The indicator identifies four main sentiment phases—Optimism, Excitement, Panic, and Depression—based on combinations of RSI, MACD, and volume data. These phases are visually represented on the chart through background color zones, allowing traders to see the prevailing market sentiment at a glance.
• Integration: The sentiment phases are determined by a combination of the RSI trend, MACD crossovers, and volume analysis. For example, a transition from “Panic” to “Optimism” is detected when the RSI recovers from oversold levels, MACD turns bullish, and volume spikes decrease. This comprehensive approach ensures that all signals are well-founded and based on multiple dimensions of market data.
5. Buy and Sell Signals:
• The buy and sell signals are generated based on crossovers and crossunders between sentiment phases. For example, a buy signal is triggered when the market moves from a “Depression” (oversold) phase to an “Optimism” phase. A sell signal is triggered when the market transitions from “Excitement” to “Panic.”
• Integration: These signals are refined by adding a minimum distance between consecutive signals to avoid noise and enhance the clarity of trading opportunities. This further ensures that signals are not generated too frequently, reducing the chance of false positives.
Justification for Combining These Components:
The combination of RSI, MACD, volume analysis, and sentiment detection into a single indicator offers a holistic approach to understanding market psychology. Here’s why this mashup is particularly effective:
• Comprehensive Sentiment Analysis: The integration of RSI and MACD provides a well-rounded view of both momentum and trend, while volume analysis adds a layer of intensity to confirm sentiment shifts.
• Reduced Noise and Enhanced Signal Quality: By using multiple indicators to filter signals, the indicator minimizes noise and reduces the likelihood of false signals. This is particularly beneficial for traders looking to capitalize on meaningful market turns rather than being whipsawed by minor fluctuations.
• Visual Clarity: The background color zones corresponding to different sentiment phases offer a clear, at-a-glance view of the market’s current state, allowing traders to make more informed decisions quickly.
• Unique Combination for Market Sentiment Detection: While many indicators focus on either trend, momentum, or volume independently, this mashup uniquely combines these elements to detect the market’s underlying emotional state, providing a more nuanced understanding of market behavior.
How to Use This Indicator:
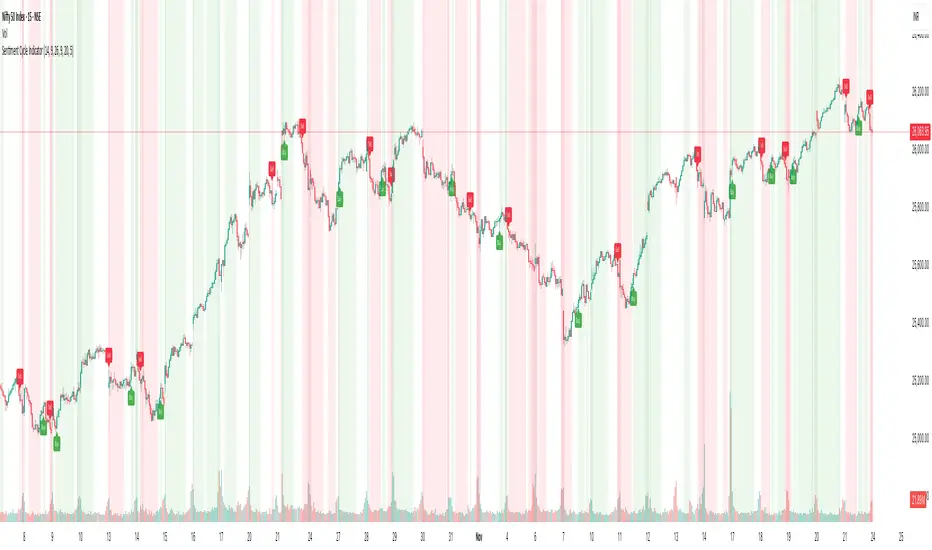
• Buy Signal: Look for the green “Buy” label when the market transitions from a bearish sentiment (grey or red zones) to a bullish sentiment (green zone).
• Sell Signal: Look for the red “Sell” label when the market transitions from a bullish sentiment (blue zone) to a bearish sentiment (red or gray zones).
• Dynamic Background Zones: Use the background color zones to visually track the prevailing market sentiment phase and anticipate potential buy or sell signals.
Originality and Practical Application:
This indicator’s originality lies in its ability to seamlessly integrate multiple widely-used technical analysis tools (RSI, MACD, and Volume) into a single, comprehensive tool for detecting market sentiment shifts. By doing so, it provides traders with a practical, easy-to-use tool that adapts to various market conditions, making it suitable for both day trading and longer-term strategies.
Conclusion:
The “Sentiment Cycle Indicator” is designed to offer traders a powerful, unified approach to identifying market sentiment shifts. By combining momentum, trend, and volume analysis, it delivers a unique and efficient way to navigate the complexities of market psychology, ultimately providing traders with an edge in understanding and predicting market movements.
Overview:
The Sentiment Cycle Indicator is a unique blend of multiple technical analysis tools designed to help traders visualize and capitalize on market sentiment shifts. This indicator combines RSI (Relative Strength Index), MACD (Moving Average Convergence Divergence), volume analysis, and sentiment cycle detection to provide actionable buy and sell signals. By monitoring the emotional stages that market participants go through—such as optimism, excitement, euphoria, anxiety, denial, panic, and depression—this indicator helps traders identify turning points in the market cycle.
Key Components and How They Work Together:
1. RSI (Relative Strength Index):
• The RSI is a momentum oscillator that measures the speed and change of price movements. In this indicator, the RSI is used to determine overbought or oversold conditions, which are then translated into signals for potential market sentiment shifts.
• Integration: The RSI provides the foundational layer to assess whether the market is generally bullish or bearish. When combined with MACD and volume analysis, it helps confirm the strength of a sentiment cycle phase.
2. MACD (Moving Average Convergence Divergence):
• MACD is a trend-following indicator that shows the relationship between two moving averages of a security’s price. It is used in this script to identify trend direction and momentum changes.
• Integration: MACD crossovers are aligned with RSI conditions to detect the shift between bullish and bearish market sentiments. The MACD’s ability to capture trend changes strengthens the identification of sentiment phases, such as “optimism” or “panic.”
3. Volume Analysis:
• Volume analysis is a critical component in understanding market sentiment. The indicator uses a moving average of volume to detect volume spikes, which often coincide with significant market moves or reversals.
• Integration: Volume spikes are used to gauge the intensity of sentiment changes. For example, high volume during a bullish or bearish sentiment phase is a strong confirmation of a market sentiment shift. This integration enhances the reliability of the buy and sell signals generated by the sentiment cycle logic.
4. Sentiment Cycles:
• The indicator identifies four main sentiment phases—Optimism, Excitement, Panic, and Depression—based on combinations of RSI, MACD, and volume data. These phases are visually represented on the chart through background color zones, allowing traders to see the prevailing market sentiment at a glance.
• Integration: The sentiment phases are determined by a combination of the RSI trend, MACD crossovers, and volume analysis. For example, a transition from “Panic” to “Optimism” is detected when the RSI recovers from oversold levels, MACD turns bullish, and volume spikes decrease. This comprehensive approach ensures that all signals are well-founded and based on multiple dimensions of market data.
5. Buy and Sell Signals:
• The buy and sell signals are generated based on crossovers and crossunders between sentiment phases. For example, a buy signal is triggered when the market moves from a “Depression” (oversold) phase to an “Optimism” phase. A sell signal is triggered when the market transitions from “Excitement” to “Panic.”
• Integration: These signals are refined by adding a minimum distance between consecutive signals to avoid noise and enhance the clarity of trading opportunities. This further ensures that signals are not generated too frequently, reducing the chance of false positives.
Justification for Combining These Components:
The combination of RSI, MACD, volume analysis, and sentiment detection into a single indicator offers a holistic approach to understanding market psychology. Here’s why this mashup is particularly effective:
• Comprehensive Sentiment Analysis: The integration of RSI and MACD provides a well-rounded view of both momentum and trend, while volume analysis adds a layer of intensity to confirm sentiment shifts.
• Reduced Noise and Enhanced Signal Quality: By using multiple indicators to filter signals, the indicator minimizes noise and reduces the likelihood of false signals. This is particularly beneficial for traders looking to capitalize on meaningful market turns rather than being whipsawed by minor fluctuations.
• Visual Clarity: The background color zones corresponding to different sentiment phases offer a clear, at-a-glance view of the market’s current state, allowing traders to make more informed decisions quickly.
• Unique Combination for Market Sentiment Detection: While many indicators focus on either trend, momentum, or volume independently, this mashup uniquely combines these elements to detect the market’s underlying emotional state, providing a more nuanced understanding of market behavior.
How to Use This Indicator:
• Buy Signal: Look for the green “Buy” label when the market transitions from a bearish sentiment (grey or red zones) to a bullish sentiment (green zone).
• Sell Signal: Look for the red “Sell” label when the market transitions from a bullish sentiment (blue zone) to a bearish sentiment (red or gray zones).
• Dynamic Background Zones: Use the background color zones to visually track the prevailing market sentiment phase and anticipate potential buy or sell signals.
Originality and Practical Application:
This indicator’s originality lies in its ability to seamlessly integrate multiple widely-used technical analysis tools (RSI, MACD, and Volume) into a single, comprehensive tool for detecting market sentiment shifts. By doing so, it provides traders with a practical, easy-to-use tool that adapts to various market conditions, making it suitable for both day trading and longer-term strategies.
Conclusion:
The “Sentiment Cycle Indicator” is designed to offer traders a powerful, unified approach to identifying market sentiment shifts. By combining momentum, trend, and volume analysis, it delivers a unique and efficient way to navigate the complexities of market psychology, ultimately providing traders with an edge in understanding and predicting market movements.
仅限邀请脚本
仅限作者授权的用户访问此脚本,并且通常需要付费。您可以将其添加到收藏中,但是只有在向作者请求并获得许可之后,才能使用它。 请联系TradeTechanalysis了解更多信息,或按照以下作者的说明操作。
TradingView does not suggest paying for a script and using it unless you 100% trust its author and understand how the script works. In many cases, you can find a good open-source alternative for free in our Community Scripts.
作者的说明
″**Instructions to Request Access:**
To gain access to this exclusive invite-only indicator:
Follow me on TradingView and Send me a direct message on TradingView with your username and a brief explanation of why you are interested in this indicator.
想在图表上使用此脚本?
警告:请在申请访问权限之前阅读。
免责声明
这些信息和出版物并不意味着也不构成TradingView提供或认可的金融、投资、交易或其它类型的建议或背书。请在使用条款阅读更多信息。